Gartner, Inc.'s management explains the business in its own materials. The slides below do the most of that work, pulled from the documents preserved in Sources. Each source link opens the complete presentation at that slide in a new tab.
Gartner's current earnings deck — its fullest routine explanation of the subscription model, three segments, unit economics and cash flow. · Open the full document →
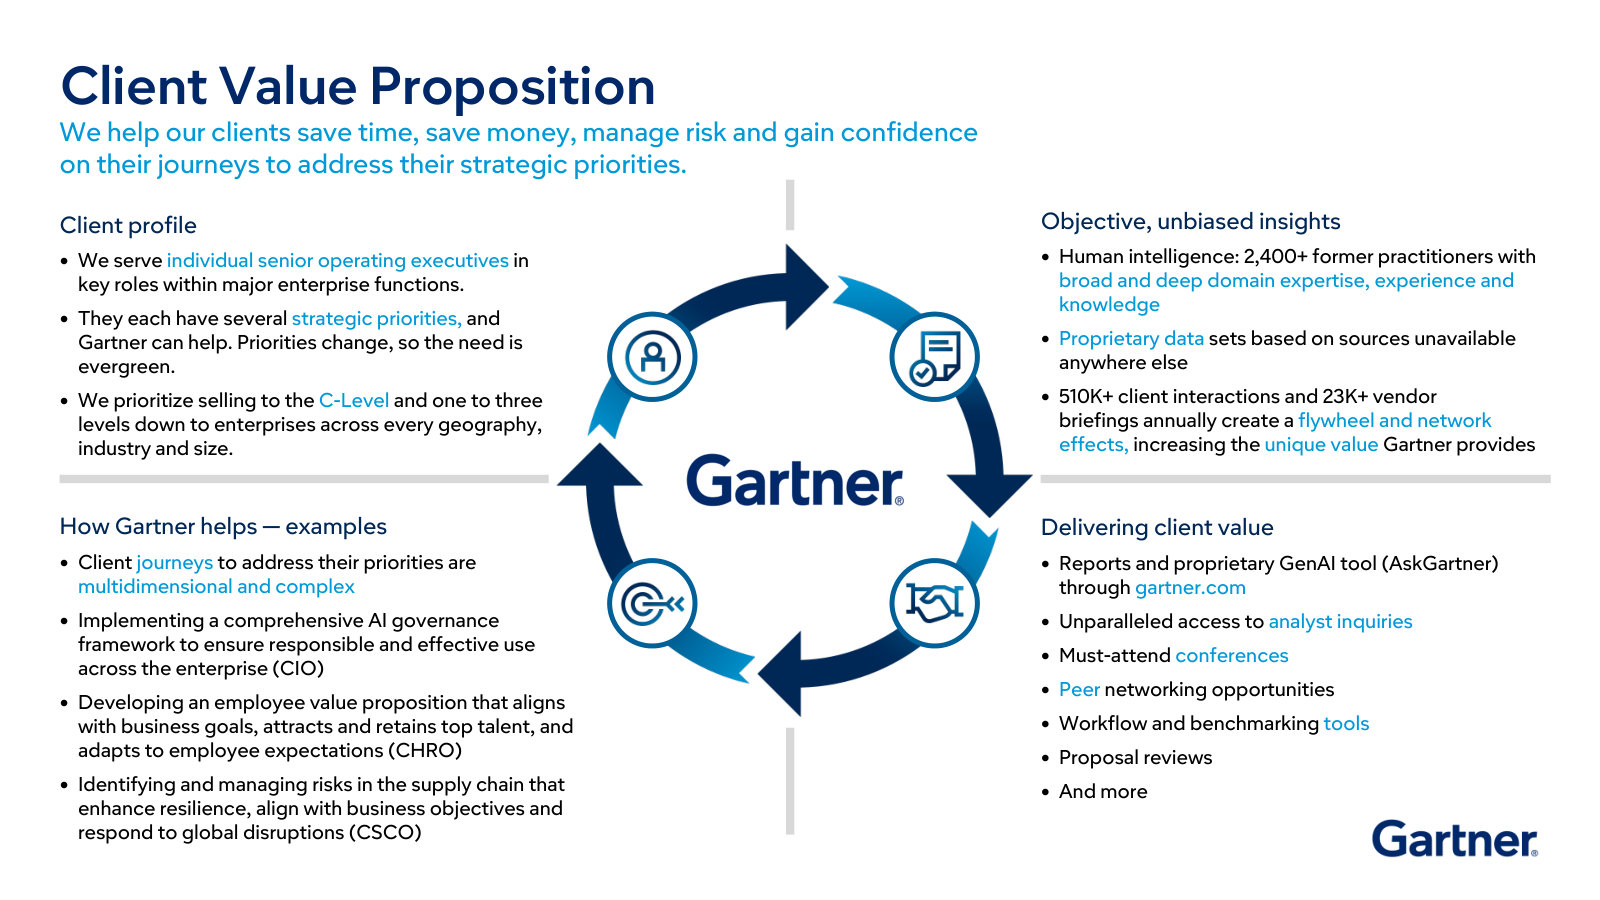
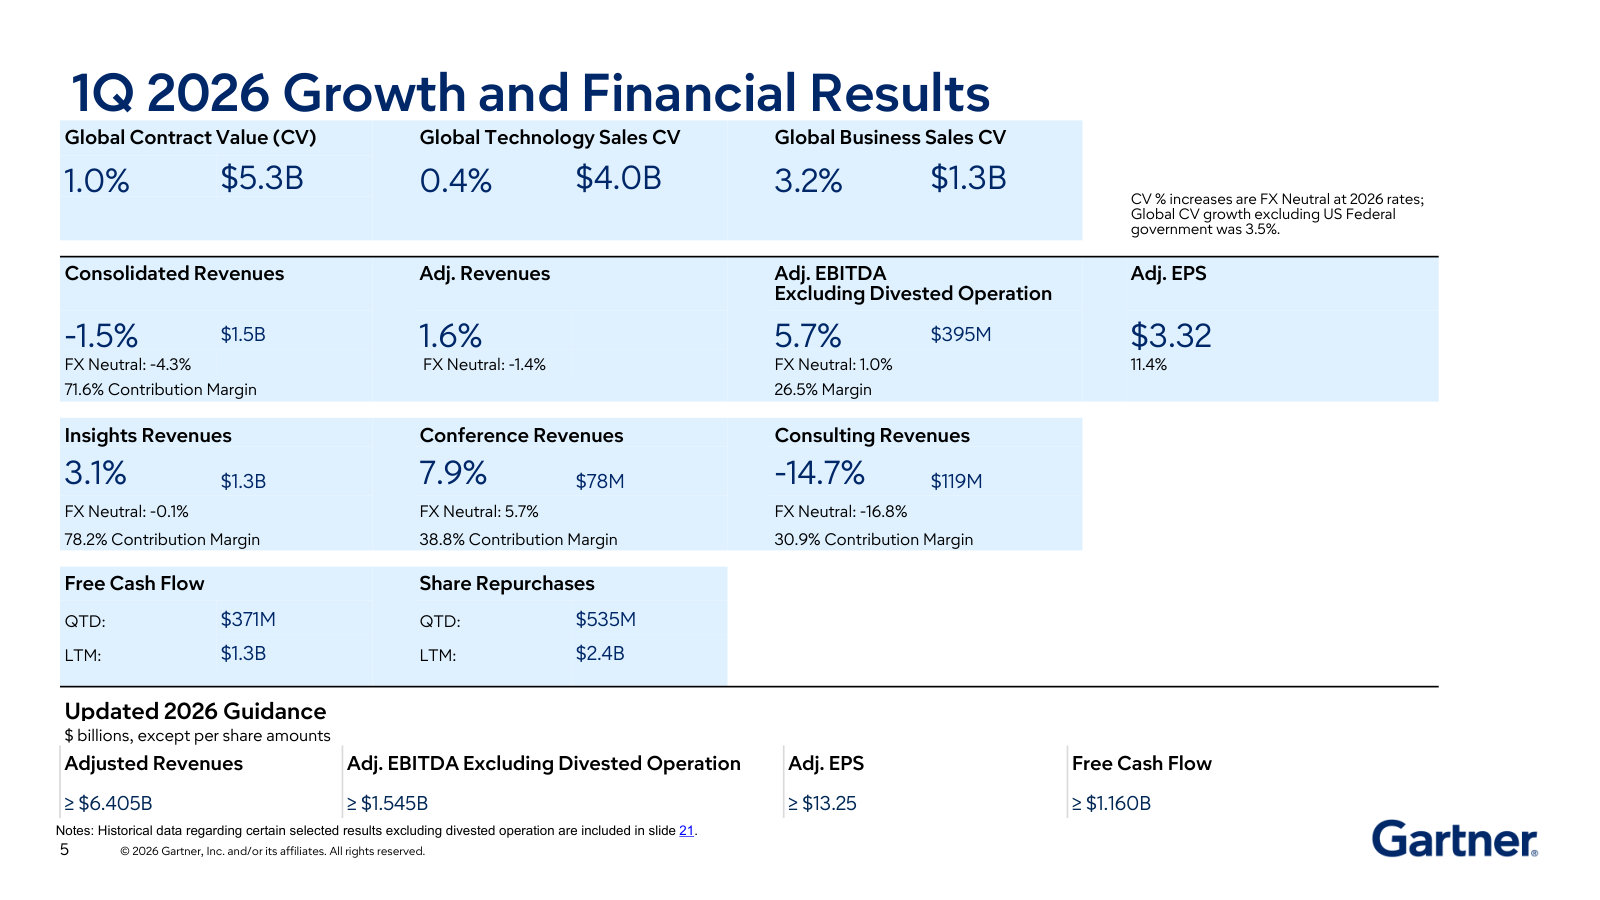
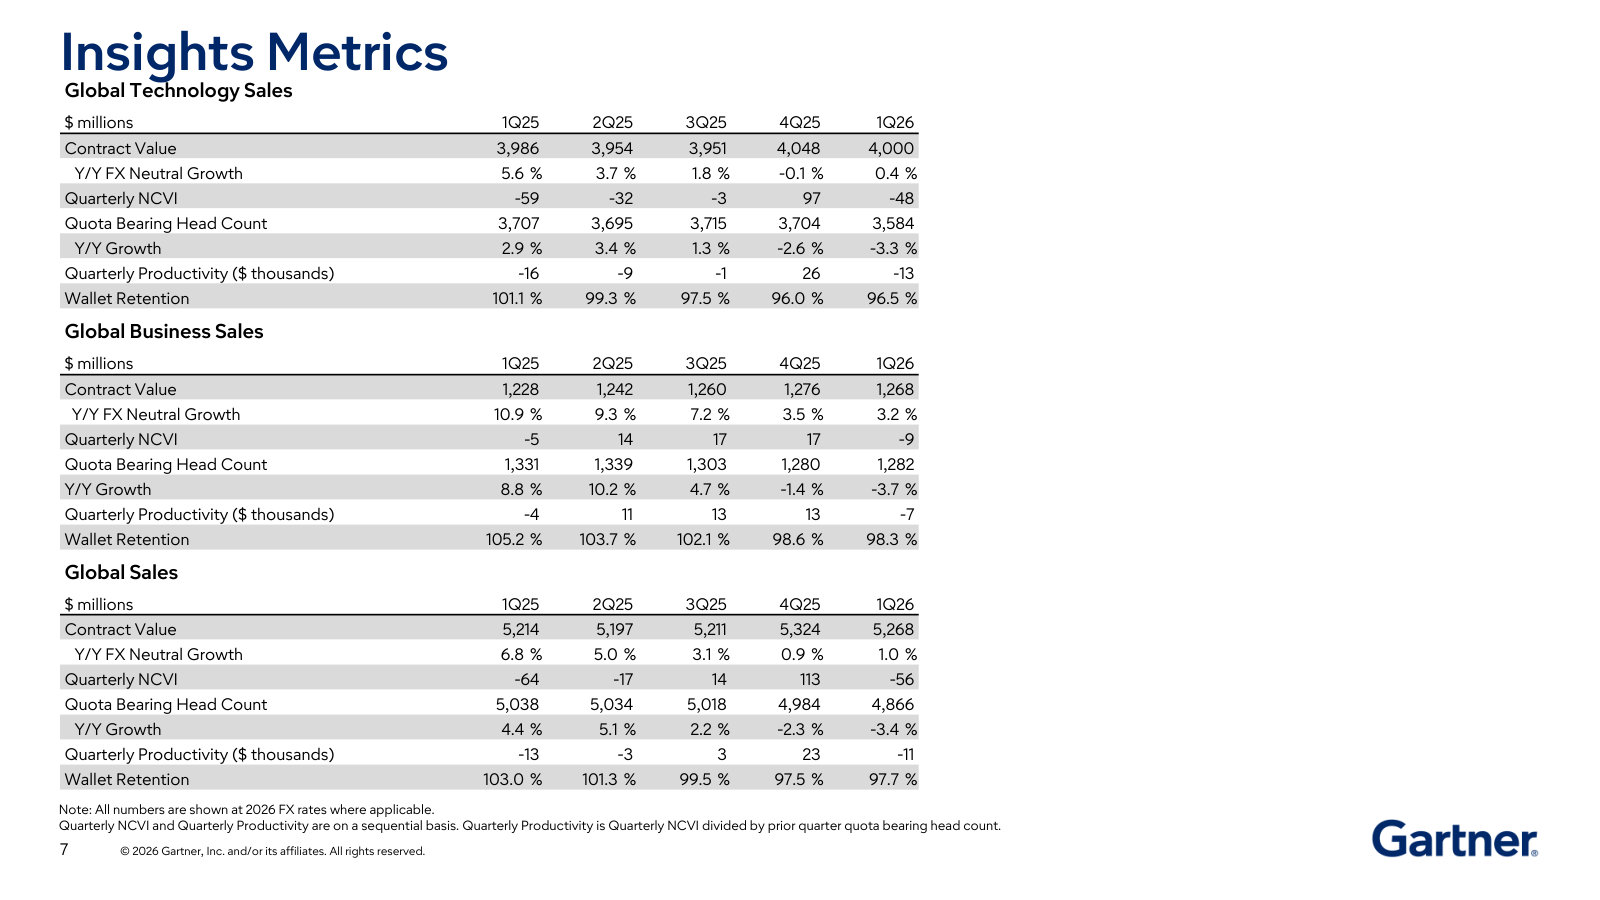
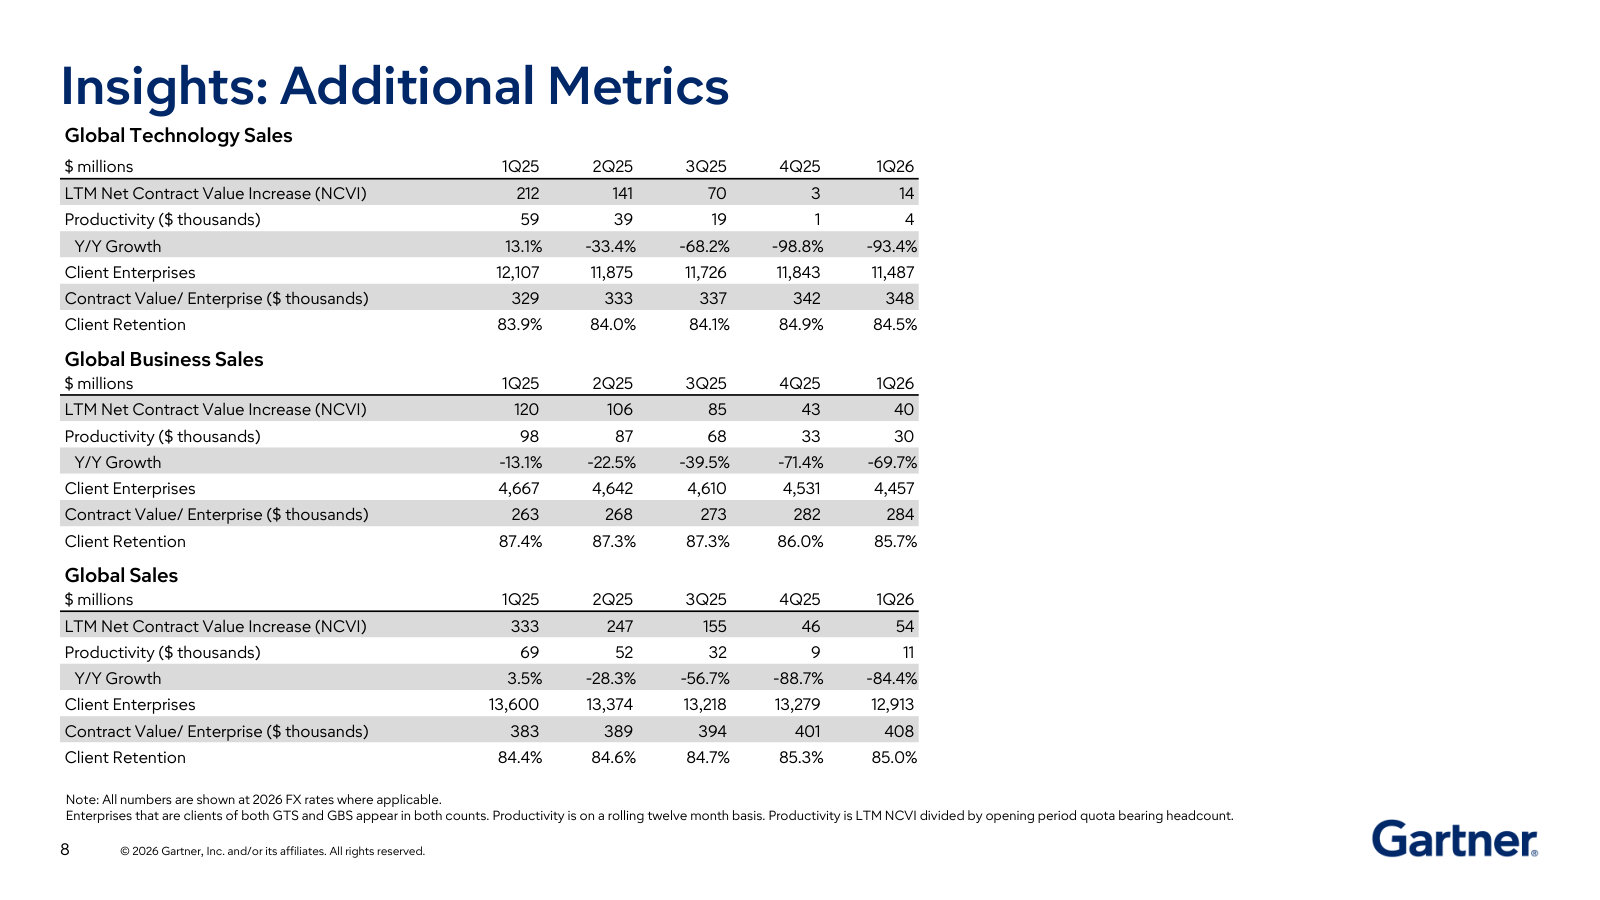
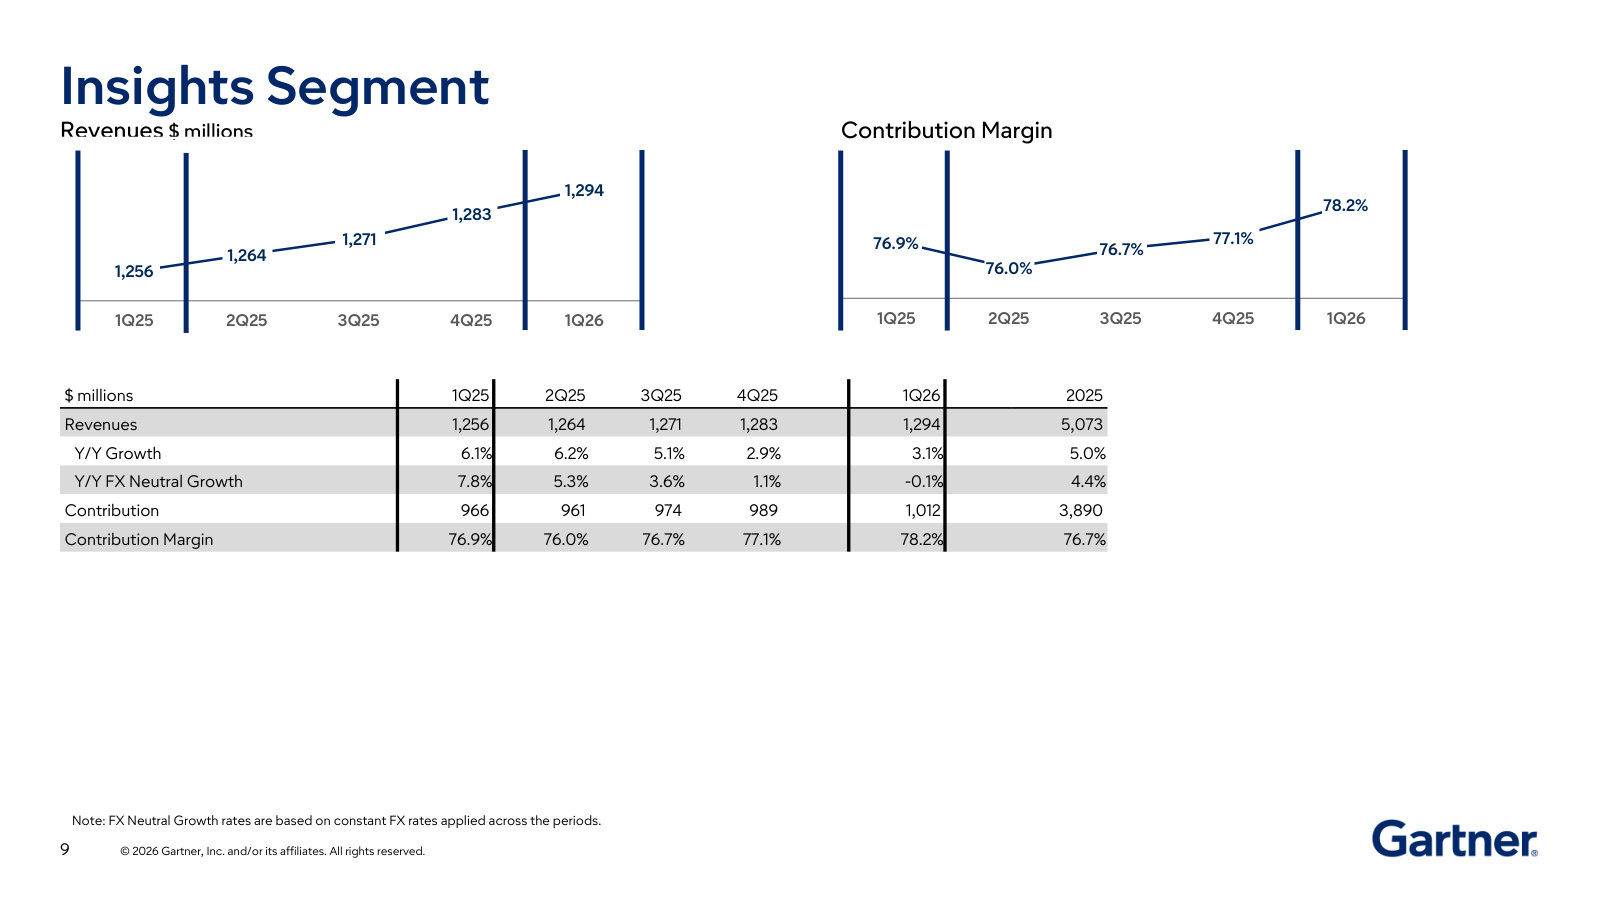
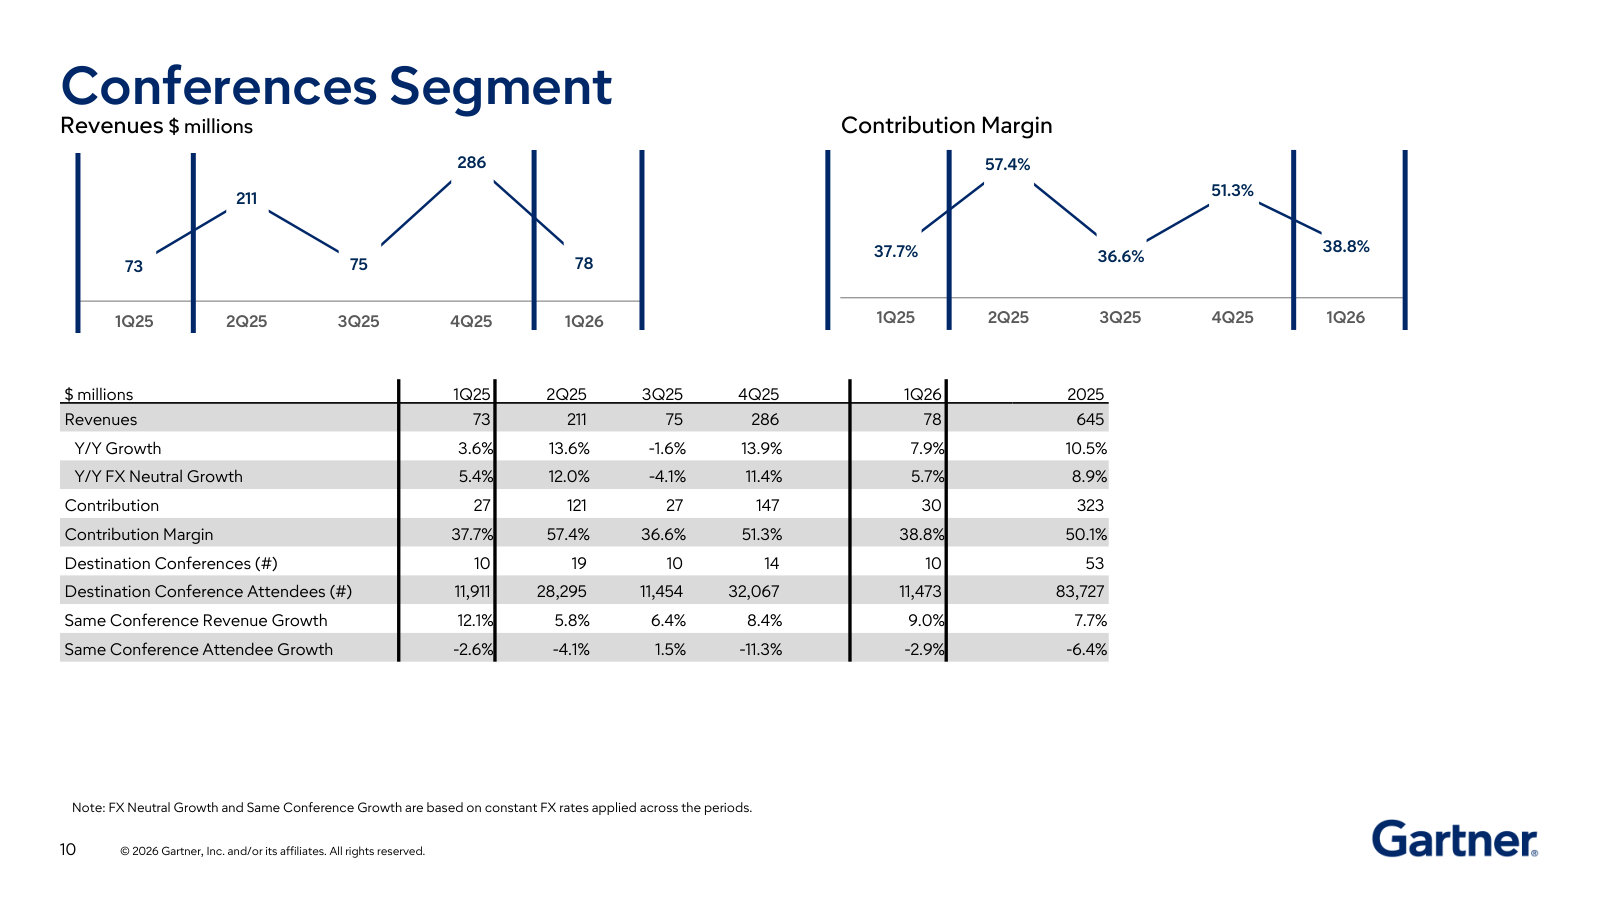
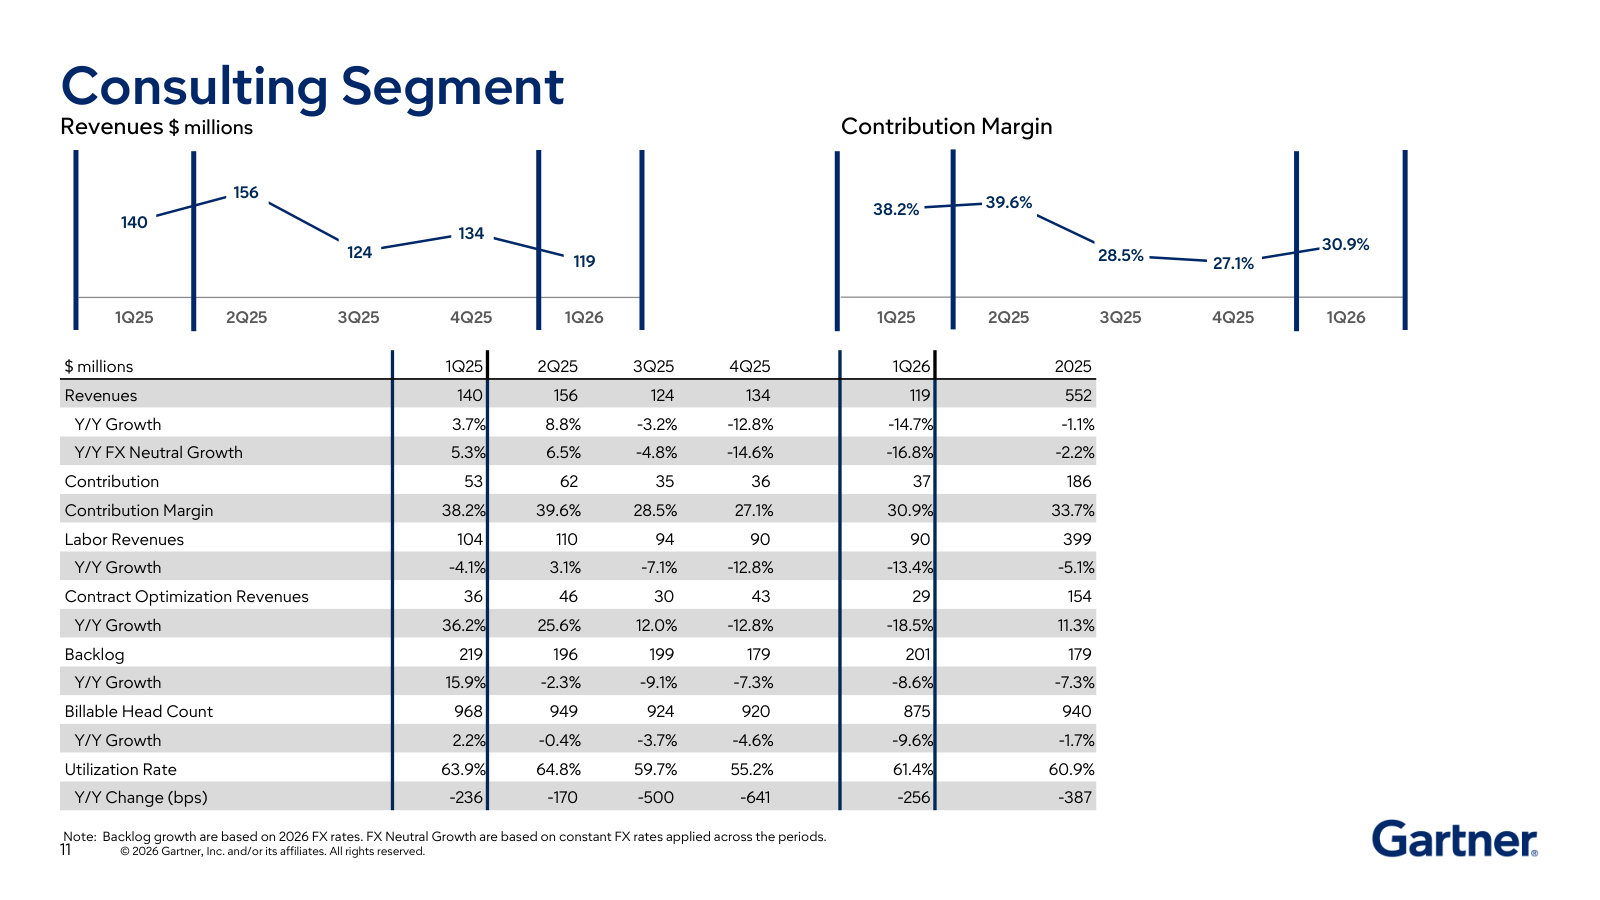
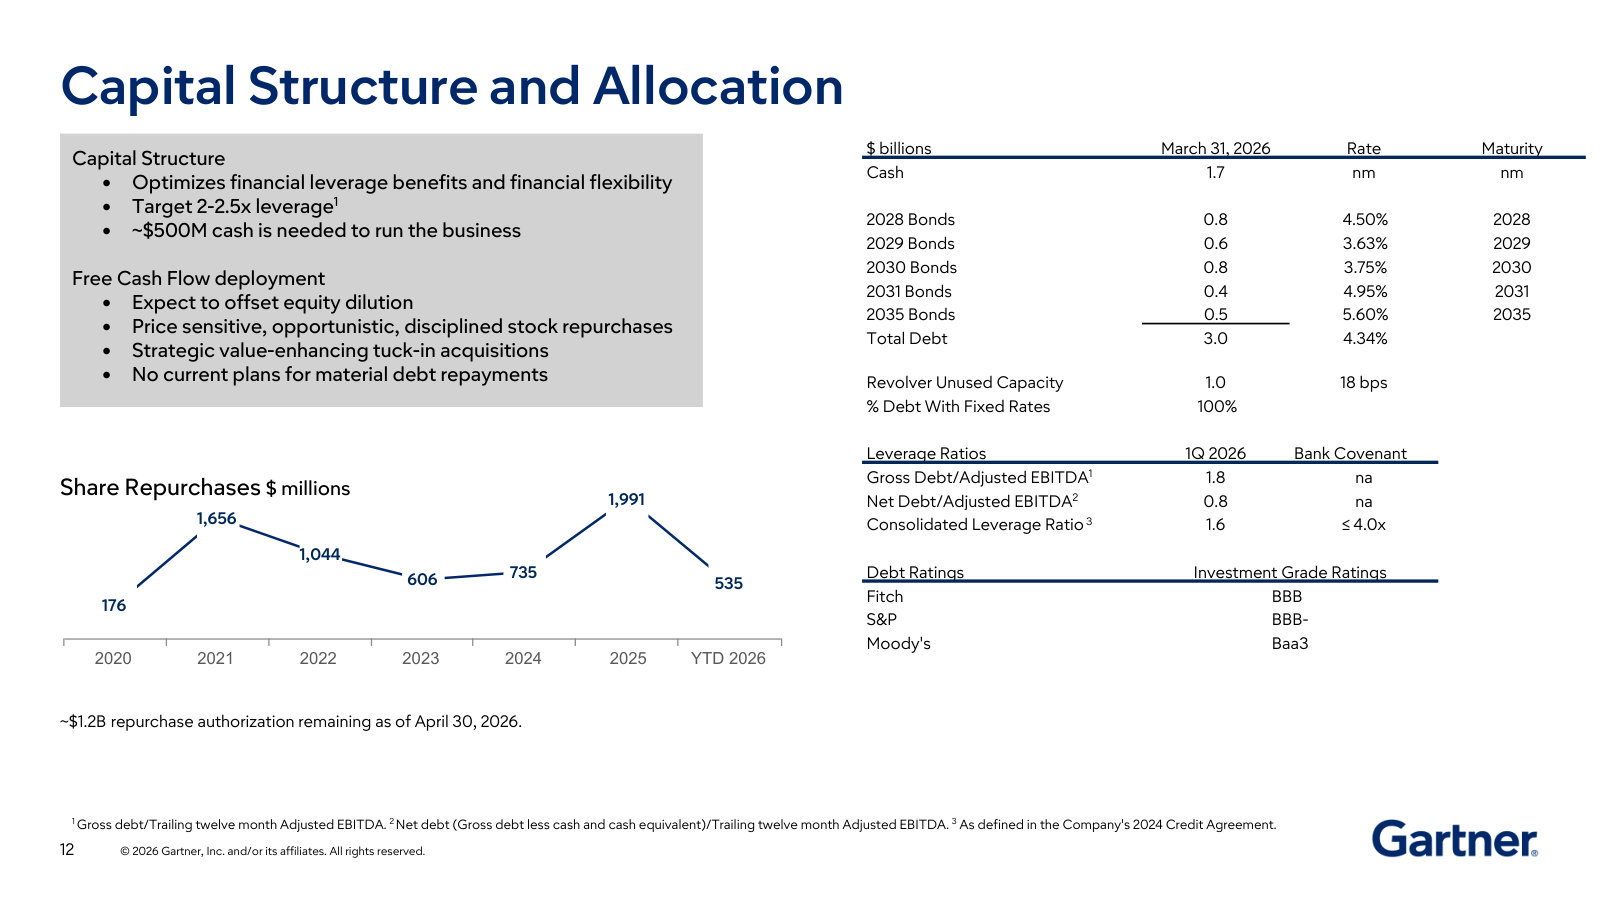
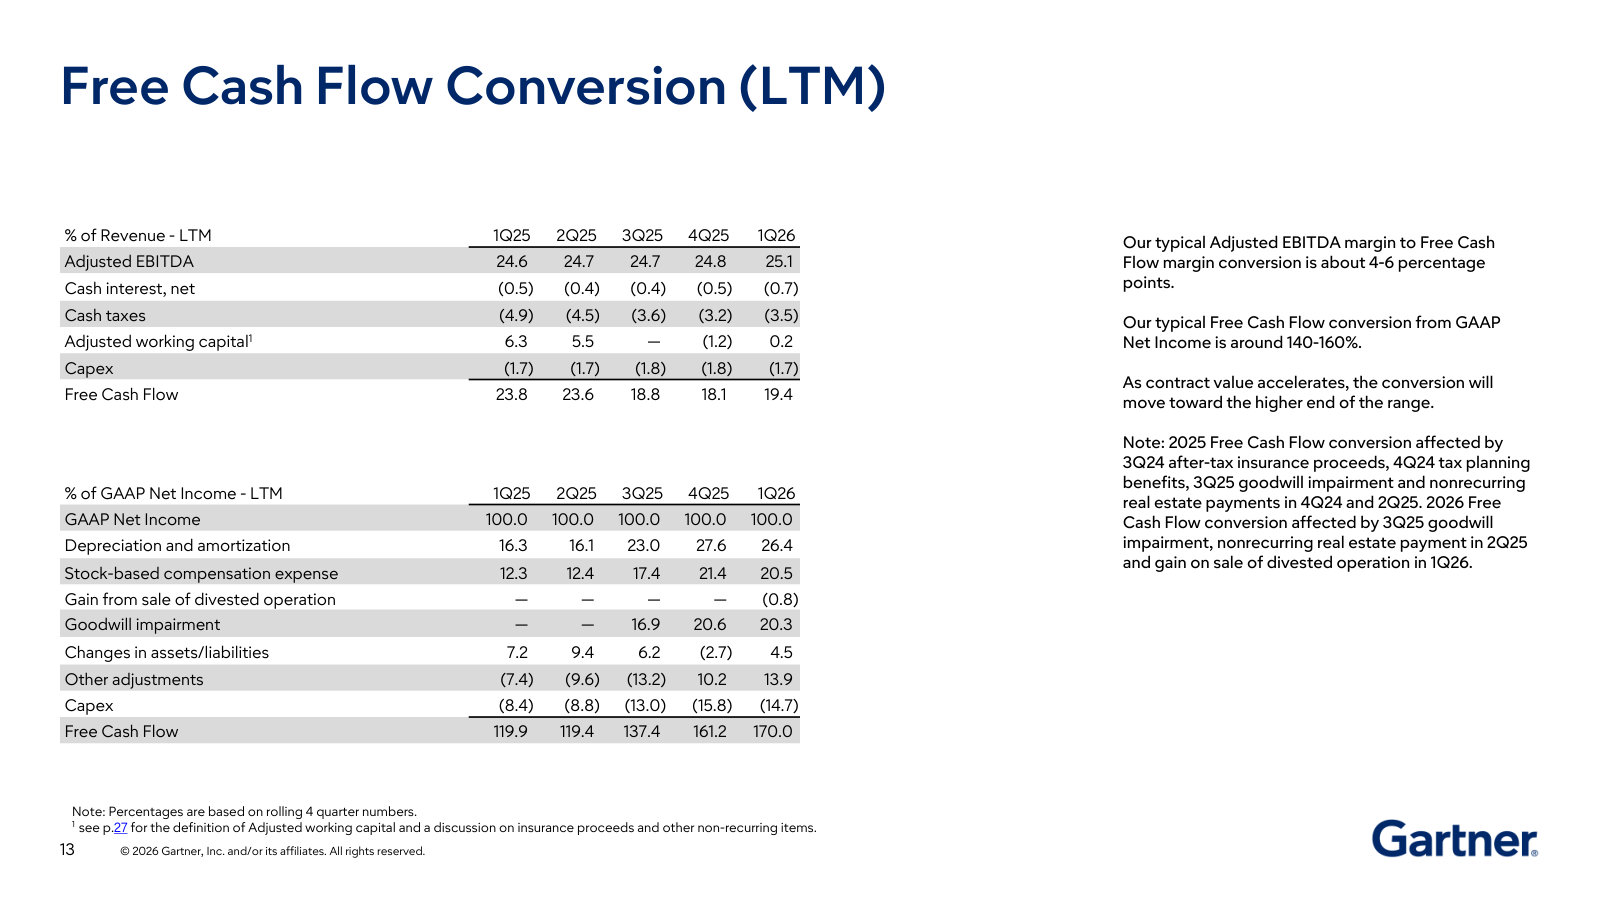
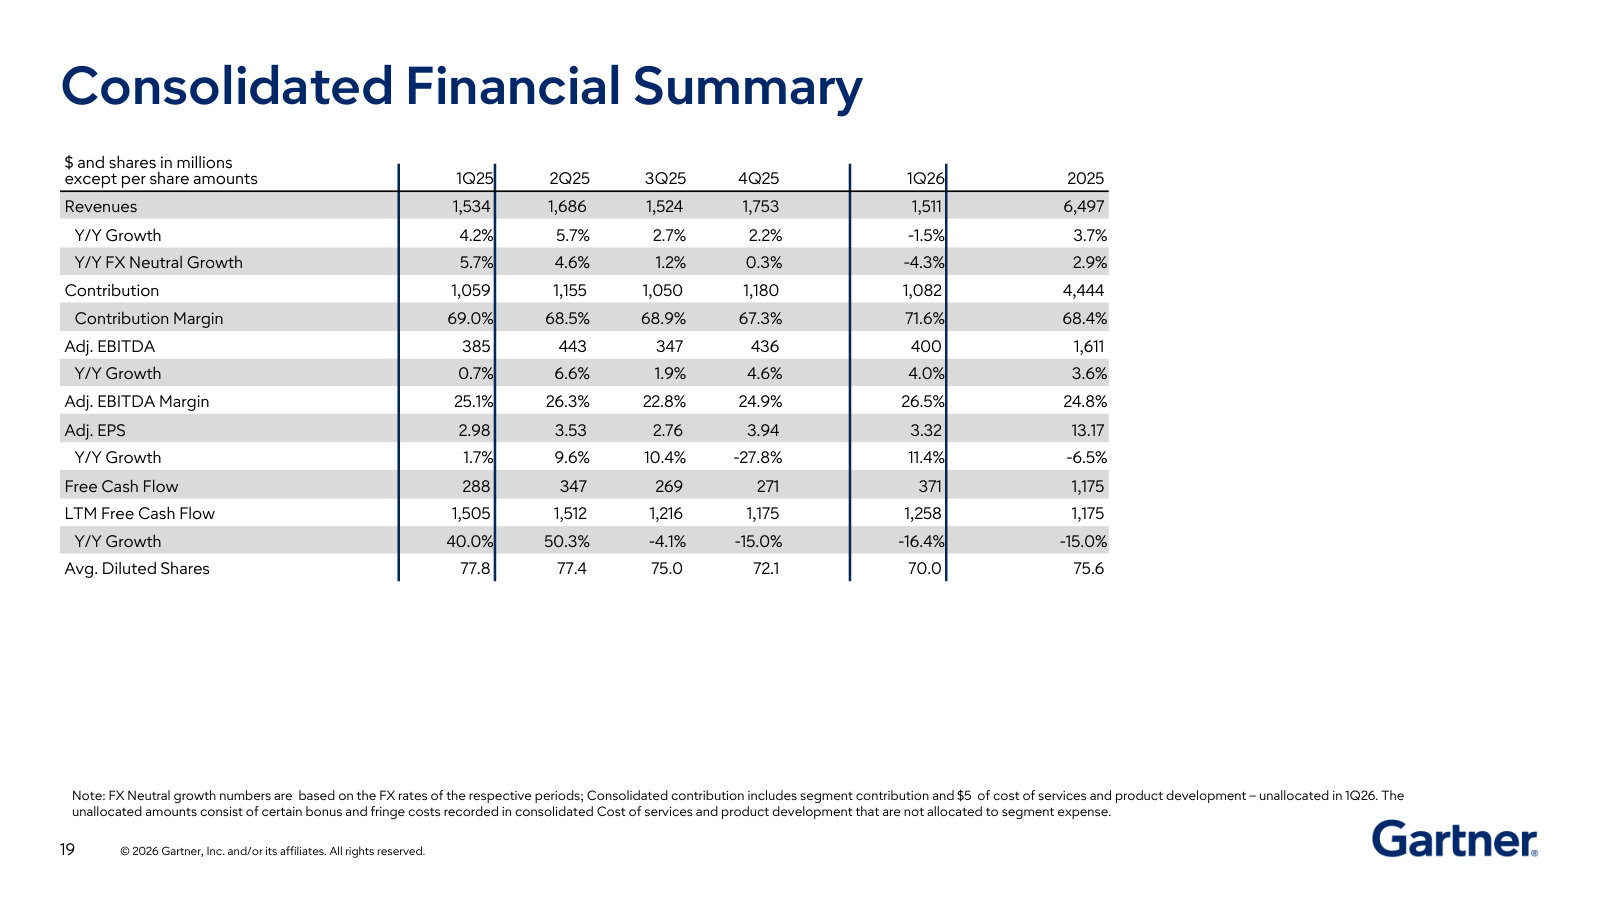
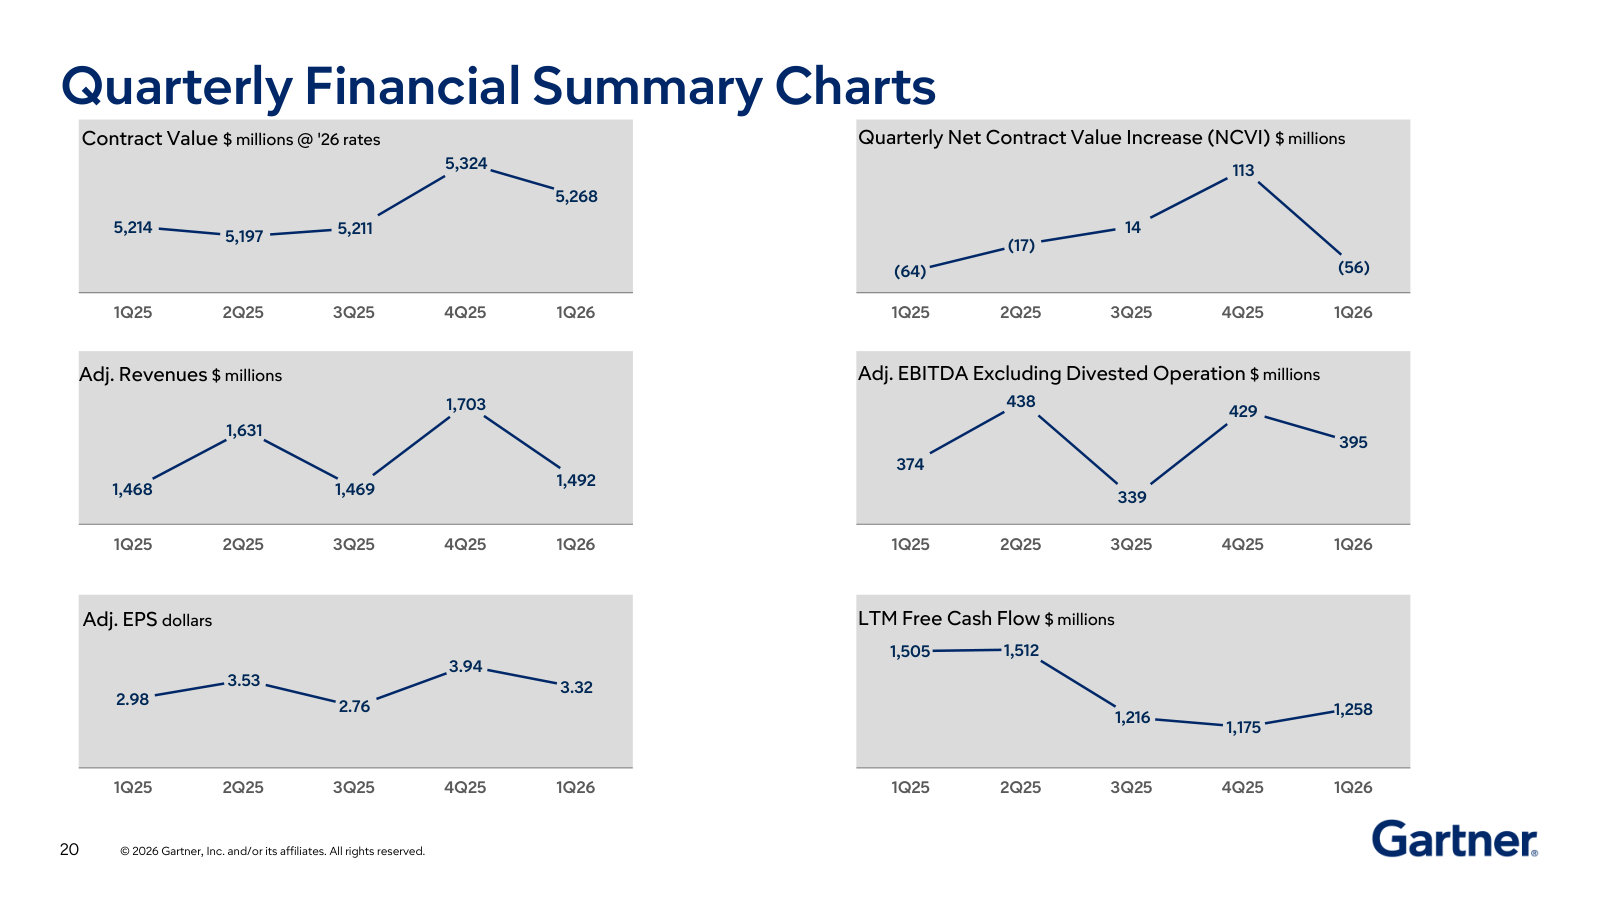
p. 4 — The flywheel — who Gartner sells to, what it delivers (analyst access, data, conferences, tools), and why retention compounds. · Open the full presentation →p. 5 — One-page dashboard: Contract Value and its growth, the three segments' revenue and contribution margins, free cash flow and buybacks. · Open the full presentation →p. 7 — The subscription engine's unit economics — contract value, quota-bearing headcount, wallet retention and productivity by sales force. · Open the full presentation →p. 8 — Insights, continued — client-enterprise counts, contract value per enterprise, and client-retention rates that anchor the recurring base. · Open the full presentation →p. 9 — Insights, the largest segment (~85% of revenue): five quarters of revenue growth and a ~78% contribution margin. · Open the full presentation →p. 10 — Conferences: revenue and margin plus the operating drivers — number of destination conferences, attendees, and same-conference growth. · Open the full presentation →p. 11 — Consulting: revenue and margin with the labor-vs-contract-optimization split, backlog, billable headcount and utilization. · Open the full presentation →p. 12 — Capital allocation in one slide — leverage target, the fixed-rate debt ladder, buyback history, and investment-grade ratings. · Open the full presentation →p. 13 — How adjusted EBITDA becomes cash — the free-cash-flow bridge and Gartner's ~140–160% conversion from GAAP net income. · Open the full presentation →p. 19 — The whole company on one page — five quarters plus full-year 2025 of revenue, contribution, adjusted EBITDA, EPS and free cash flow. · Open the full presentation →p. 20 — The same trajectory as charts — contract value, net contract value increase, adjusted revenue and EBITDA, EPS and LTM free cash flow. · Open the full presentation →
Gartner Fourth Quarter 2025 Results — FY2025 / Q4 2025 · 33 pages · Full-year 2025 as the headline period — the clean FY2025 segment and cash-flow snapshot, structurally identical to the featured deck. · Open →
Gartner Fourth Quarter 2024 Results — FY2024 · 28 pages · Full-year 2024 results — the prior-year baseline for revenue, segment mix, margins and free cash flow. · Open →
Gartner Fourth Quarter 2023 Results — FY2023 · 28 pages · Full-year 2023 results — an earlier baseline covering the post-pandemic conference recovery. · Open →