Full Report
The numbers behind Gartner, Inc.: as-reported financial statements and company metrics for FY2021–FY2025, traced to the source filings, opened with the share-price history those statements have to justify. Every linked figure opens the exact page of the filing it was printed on, with the statement row highlighted. Amounts in US$ thousands unless noted.
Reading notes: All figures are in thousands of U.S. dollars as printed in the filings ('IN THOUSANDS, EXCEPT PER SHARE DATA'), except per-share amounts, share counts (also in thousands as printed), conference attendees (absolute count), and per-share/percent rows. Revenue disaggregation: through the FY2024 10-K, Gartner reported revenue as Research / Conferences / Consulting. In the FY2025 10-K the 'Research' line was restated into two lines, 'Insights' and 'Other,' with FY2023 and FY2024 comparatives recast; Research = Insights + Other (e.g., FY2024: 4,829,051 + 296,599 = 5,125,650). FY2021 and FY2022 predate the restatement, so their Insights and Other cells are left blank; Conferences, Consulting and Total revenues are shown for all years. Segment Gross Contribution (the CODM's profit measure) is shown for FY2023-FY2025 on the restated Insights/Conferences/Consulting/Other basis from the FY2025 10-K segment note; FY2021-FY2022 predate this presentation and are left blank. FY2024 net income was inflated by a $300.0M gain on event cancellation insurance claims and a large income-tax benefit; FY2025 operating income and net income were reduced by a $150.0M goodwill impairment. These are the reported (GAAP) figures.
Share Price — Full Available History — 10 Years
The stock closed at $141.61 on Jul 07, 2026 — up 46% over the window shown (+3.8% a year), trading between $83.24 and $551.80. At that close the stock trades at 15× FY2025 diluted EPS as reported below.
Source: market price feed, weekly closes, sampled from 2,513 source observations, Jul 2016–Jul 2026. Price return only, excludes dividends.
FY2025 at a Glance
Revenue (US$ thousands)
Operating income (US$ thousands)
Net income (US$ thousands)
Diluted EPS
Source: FY2025 consolidated statements [1] [2]. Click any linked figure to open the filing page with the row highlighted.
Revenue by Category
| Revenue by Category | FY2021 | FY2022 | FY2023 | FY2024 | FY2025 |
|---|---|---|---|---|---|
| Insights | — | — | 4,516,035 | 4,829,051 | 5,072,570 |
| Conferences | 214,449 | 389,273 | 505,164 | 583,224 | 644,743 |
| Consulting | 418,121 | 481,782 | 514,746 | 558,537 | 552,499 |
| Other | — | — | 371,011 | 296,599 | 227,414 |
| Total revenues | 4,733,962 | 5,475,846 | 5,906,956 | 6,267,411 | 6,497,226 |
| Total revenues growth, derived | — | +15.7% | +7.9% | +6.1% | +3.7% |
Source: Consolidated Statements of Operations (revenue disaggregation); FY2025 10-K restated Research into Insights and Other [1] [2]. Click any linked figure to open the filing page with the row highlighted.
Segment Gross Contribution
| Segment Gross Contribution | FY2021 | FY2022 | FY2023 | FY2024 | FY2025 |
|---|---|---|---|---|---|
| Insights | — | — | 3,443,731 | 3,696,833 | 3,890,185 |
| Conferences | — | — | 253,739 | 281,409 | 322,844 |
| Consulting | — | — | 181,501 | 203,292 | 186,430 |
| Other | — | — | 156,412 | 96,010 | 68,757 |
| Total gross contribution | — | — | 4,035,383 | 4,277,544 | 4,468,216 |
Source: Note — Segment Information; gross contribution is the CODM's profit measure [3] [4]. Click any linked figure to open the filing page with the row highlighted.
Income Statement
Source: Consolidated Statements of Operations [1] [2]. Click any linked figure to open the filing page with the row highlighted.
Columns marked E are consensus analyst estimates shown alongside reported results for direct comparison; they are not company guidance.
Estimate source: Yahoo Finance analyst consensus, as of 2026-07-07. Estimate figures link to the consensus source, not to filing pages.
Balance Sheet
Source: Consolidated Balance Sheets [5] [6] [7]. Click any linked figure to open the filing page with the row highlighted.
Cash Flow
Source: Consolidated Statements of Cash Flows [8] [9]. Click any linked figure to open the filing page with the row highlighted.
Insights (Research) Subscription
| Insights (Research) Subscription | FY2021 | FY2022 | FY2023 | FY2024 | FY2025 |
|---|---|---|---|---|---|
| Total Insights contract value (FX-neutral) | — | — | 4,838,600 | 5,262,000 | 5,155,000 |
| Global Technology Sales (GTS) contract value | 3,373,000 | 3,632,200 | 3,747,600 | 4,029,000 | 3,910,000 |
| Global Business Sales (GBS) contract value | 874,000 | 1,028,200 | 1,091,000 | 1,233,000 | 1,245,000 |
| Distinct client enterprises (approx.) | 15,000 | 15,000 | 15,000 | 14,000 | 13,000 |
| Direct client interactions | 495,000 | 460,000 | 490,000 | 505,000 | 510,000 |
Source: company filings [10] [11] [12] [13]. Click any linked figure to open the filing page with the row highlighted.
Client Retention (Insights)
| Client Retention (Insights) | FY2021 | FY2022 | FY2023 | FY2024 | FY2025 |
|---|---|---|---|---|---|
| GTS client retention | 86.0% | 86.0% | 83.0% | 84.0% | 85.0% |
| GTS wallet retention | 106.0% | 105.0% | 101.0% | 102.0% | 96.0% |
| GBS client retention | 87.0% | 89.0% | 87.0% | 87.0% | 86.0% |
| GBS wallet retention | 115.0% | 112.0% | 107.0% | 106.0% | 99.0% |
Source: company filings [10] [12] [14] [15]. Click any linked figure to open the filing page with the row highlighted.
Conferences Consulting Operating Metrics
| Conferences Consulting Operating Metrics | FY2021 | FY2022 | FY2023 | FY2024 | FY2025 |
|---|---|---|---|---|---|
| Number of destination conferences | 39 | 41 | 47 | 51 | 53 |
| Destination conference attendees | 57,145 | 60,104 | 75,569 | 86,625 | 83,727 |
| Consulting backlog | 116,700 | 139,700 | 162,100 | 191,500 | 173,700 |
| Average billable consultant headcount | 749 | 827 | 934 | 956 | 940 |
| Consultant utilization rate | 68.0% | 70.0% | 65.0% | 65.0% | 61.0% |
Source: company filings [16] [17] [18] [19]. Click any linked figure to open the filing page with the row highlighted.
Long-Term Record
| Fiscal year | Total revenue | Operating income | Net income | Diluted earnings per share |
|---|---|---|---|---|
| FY2016 | 2,444,540 | 305,141 | 193,582 | 2.31 |
| FY2017 | 3,311,494 | (6,329) | 3,279 | 0.04 |
| FY2018 | 3,975,454 | 259,715 | 122,456 | 1.33 |
| FY2019 | 4,245,321 | 370,087 | 233,290 | 2.56 |
| FY2020 | 4,099,403 | 490,150 | 266,745 | 2.96 |
| FY2021 | 4,733,962 | 915,751 | 793,560 | 9.21 |
| FY2022 | 5,475,846 | 1,100,106 | 807,799 | 9.96 |
| FY2023 | 5,906,956 | 1,236,894 | 882,466 | 11.08 |
| FY2024 | 6,267,411 | 1,156,287 | 1,253,715 | 16.00 |
| FY2025 | 6,497,226 | 1,025,711 | 729,231 | 9.65 |
Source: consolidated statements across filings; older years from the standardized feed [1] [20]. Click any linked figure to open the filing page with the row highlighted.
Operating KPIs
| KPI | FY2021 | FY2022 | FY2023 | FY2024 | FY2025 |
|---|---|---|---|---|---|
| Total contract value | — | — | — | 5,114,000 | 5,155,000 |
| Global Technology Sales contract value | — | — | — | 3,911,000 | 3,910,000 |
| Global Business Sales contract value | — | — | — | 1,203,000 | 1,245,000 |
| Destination conferences attendees | — | — | — | 86,625 | 83,727 |
| Consulting backlog | — | — | — | 187,200 | 173,700 |
Source: company-reported operating metrics [16] [10]. Click any linked figure to open the filing page with the row highlighted.
Analyst Consensus
Current price
Mean target
Median target
High target
Low target
Estimate source: Yahoo Finance analyst consensus, as of 2026-07-07. Estimate figures link to the consensus source, not to filing pages.
Traceability
325 of 392 figures on this page (83%) link to the filing page where they are printed — click a linked figure to open the source PDF at that page with the row highlighted. Unlinked figures come from standardized data feeds or pre-filing years.
All figures are in thousands of U.S. dollars as printed in the filings ('IN THOUSANDS, EXCEPT PER SHARE DATA'), except per-share amounts, share counts (also in thousands as printed), conference attendees (absolute count), and per-share/percent rows.
Revenue disaggregation: through the FY2024 10-K, Gartner reported revenue as Research / Conferences / Consulting. In the FY2025 10-K the 'Research' line was restated into two lines, 'Insights' and 'Other,' with FY2023 and FY2024 comparatives recast; Research = Insights + Other (e.g., FY2024: 4,829,051 + 296,599 = 5,125,650). FY2021 and FY2022 predate the restatement, so their Insights and Other cells are left blank; Conferences, Consulting and Total revenues are shown for all years.
Segment Gross Contribution (the CODM's profit measure) is shown for FY2023-FY2025 on the restated Insights/Conferences/Consulting/Other basis from the FY2025 10-K segment note; FY2021-FY2022 predate this presentation and are left blank.
FY2024 net income was inflated by a $300.0M gain on event cancellation insurance claims and a large income-tax benefit; FY2025 operating income and net income were reduced by a $150.0M goodwill impairment. These are the reported (GAAP) figures.
Income-statement FY2023-FY2025 columns are cited to the FY2025 10-K (p.73), which prints all three years; FY2021-FY2022 columns are cited to the FY2023 10-K (p.68). Balance-sheet FY2024/FY2025 cited to the FY2025 10-K (p.72), FY2022/FY2023 to the FY2023 10-K (p.67), FY2021 to the FY2022 10-K (p.66). Cash-flow FY2023-FY2025 to the FY2025 10-K (p.76), FY2021-FY2022 to the FY2023 10-K (p.71).
Cash-flow 'Acquisitions - cash paid' FY2025 = 0 (printed as an em-dash, no cash acquisitions in 2025); left uncited as there is no numeric figure to highlight.
FY2016-FY2018 long-term-record figures come from the standardized SEC XBRL data feed and are shown without page links (no filing in the corpus predates the FY2021 10-K). FY2019-FY2021 and FY2025 long-term cells are cited.
Quarterly Q1 FY25-Q3 FY25 and Q1 FY26 are from the respective Forms 10-Q (single-quarter columns, in thousands). Q4 FY25 has no 10-Q; it is taken from the Q4 FY2025 earnings 8-K (2026-02-03), which prints the single-quarter statement of operations in millions - values were converted to thousands for display (e.g., $1,752.6M shown as 1,752,600), and the citation highlights the printed millions figure. Q4 FY25 balance sheet is the FY2025 10-K (Dec 31, 2025) column.
Quarterly cash flow is omitted: the 10-Qs print cash flows only on a year-to-date basis and the display scale differs from the Q4 earnings release; the annual cash-flow statement and the numeric feed cover the cash-flow trend.
2 figure(s) differed between the data feed and the filing; the filing value is shown (see the run's metrics/metrics_tab.json for the audit trail).
Gartner, Inc.'s management explains the business in its own materials. The slides below do the most of that work, pulled from the documents preserved in Sources. Each source link opens the complete presentation at that slide in a new tab.
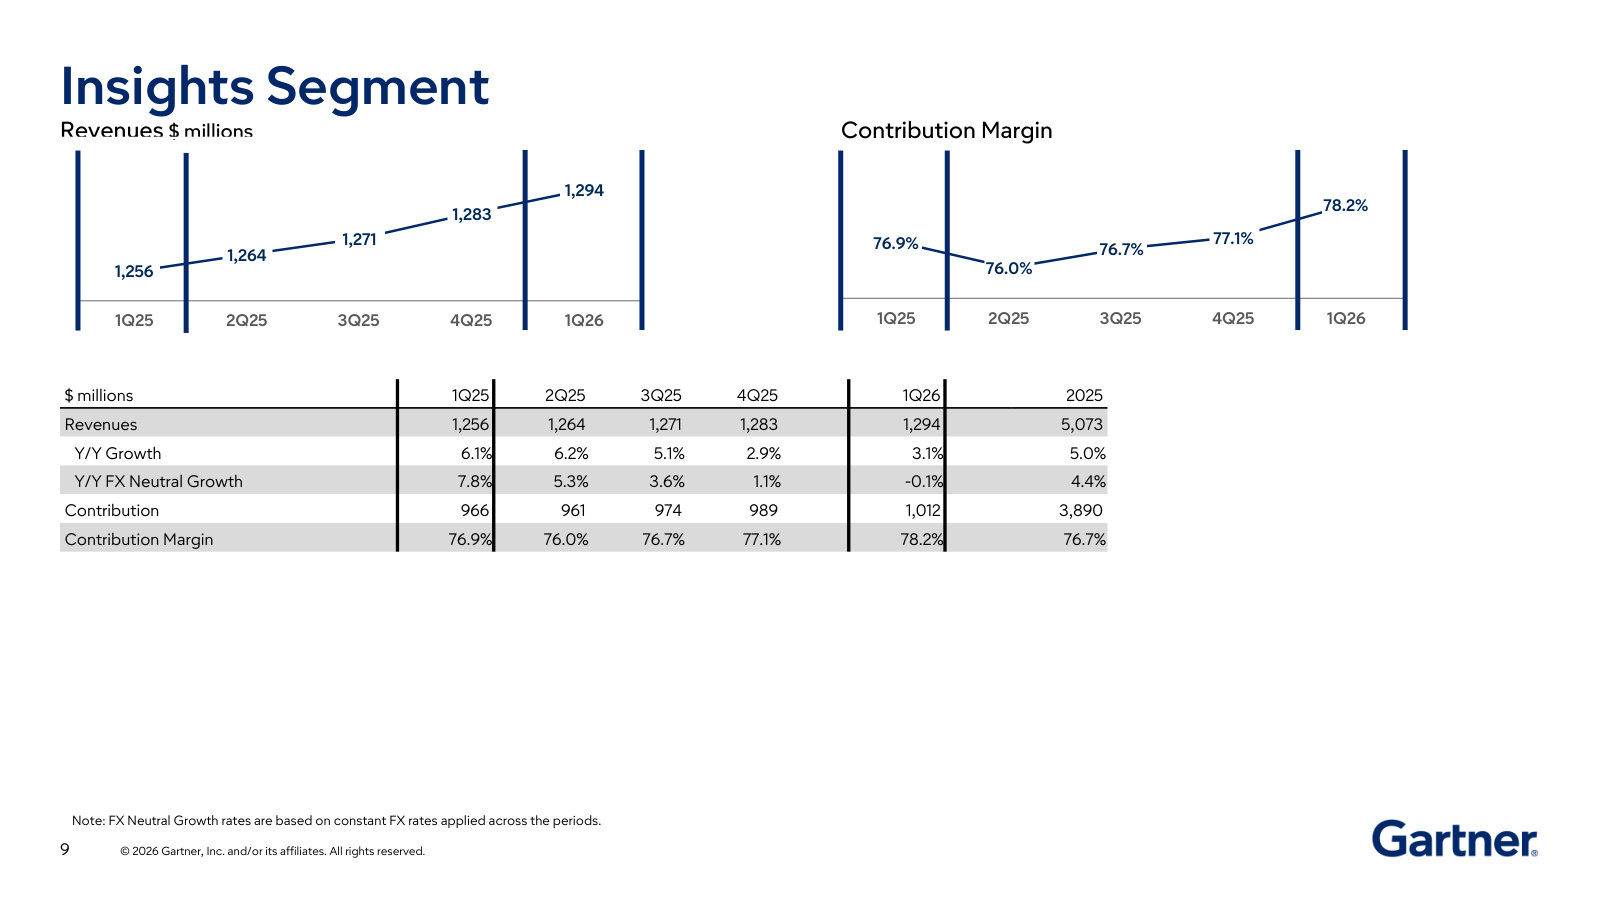
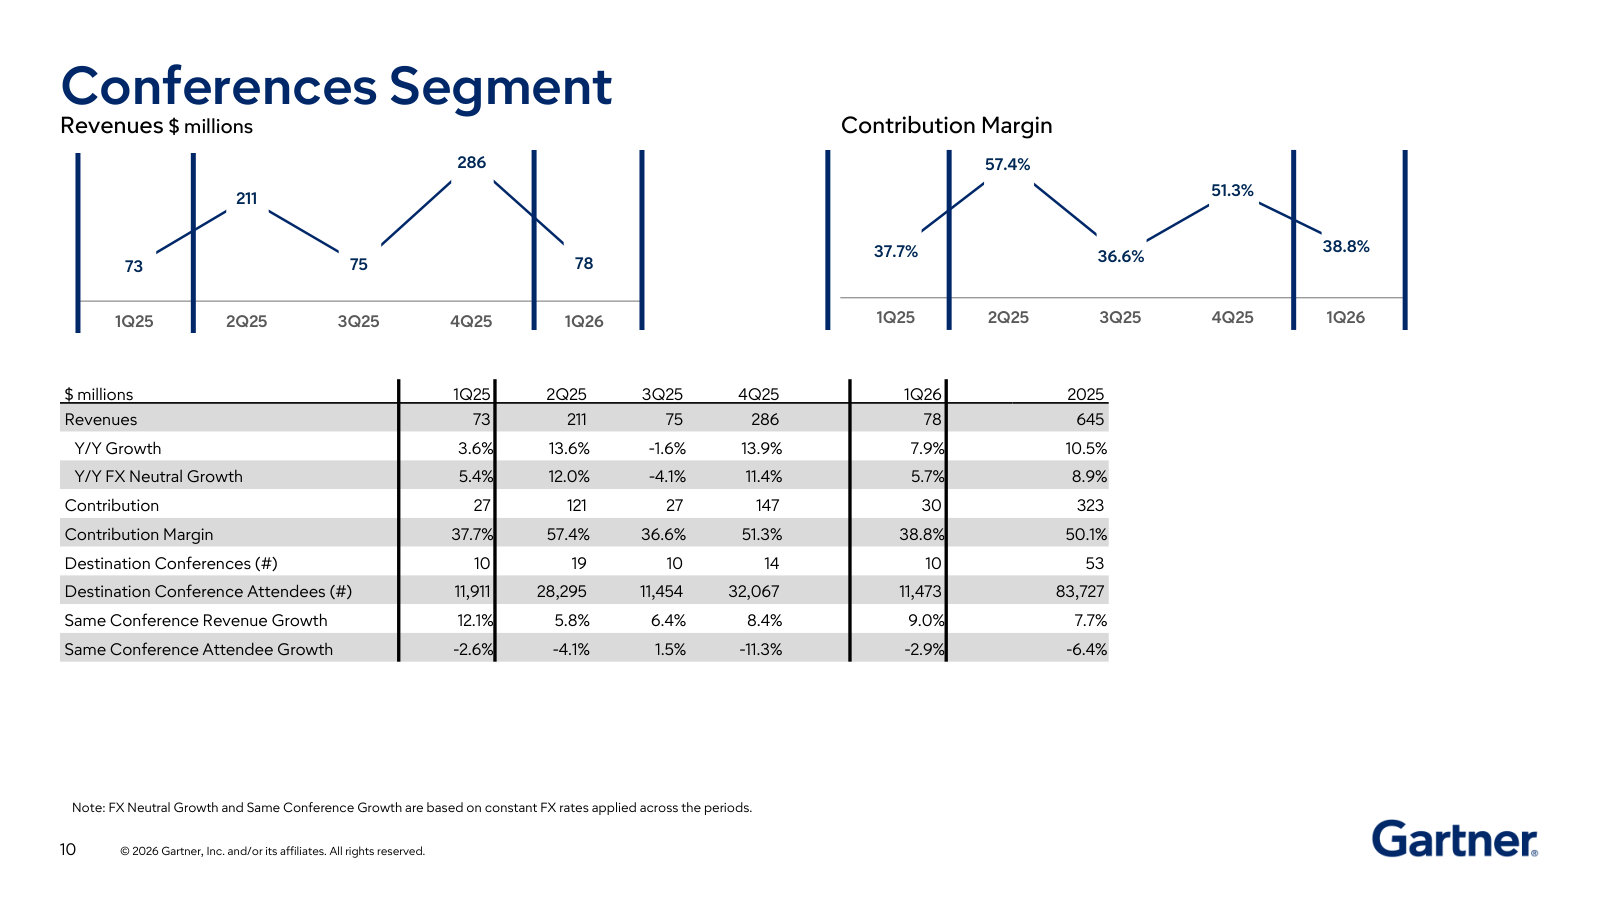
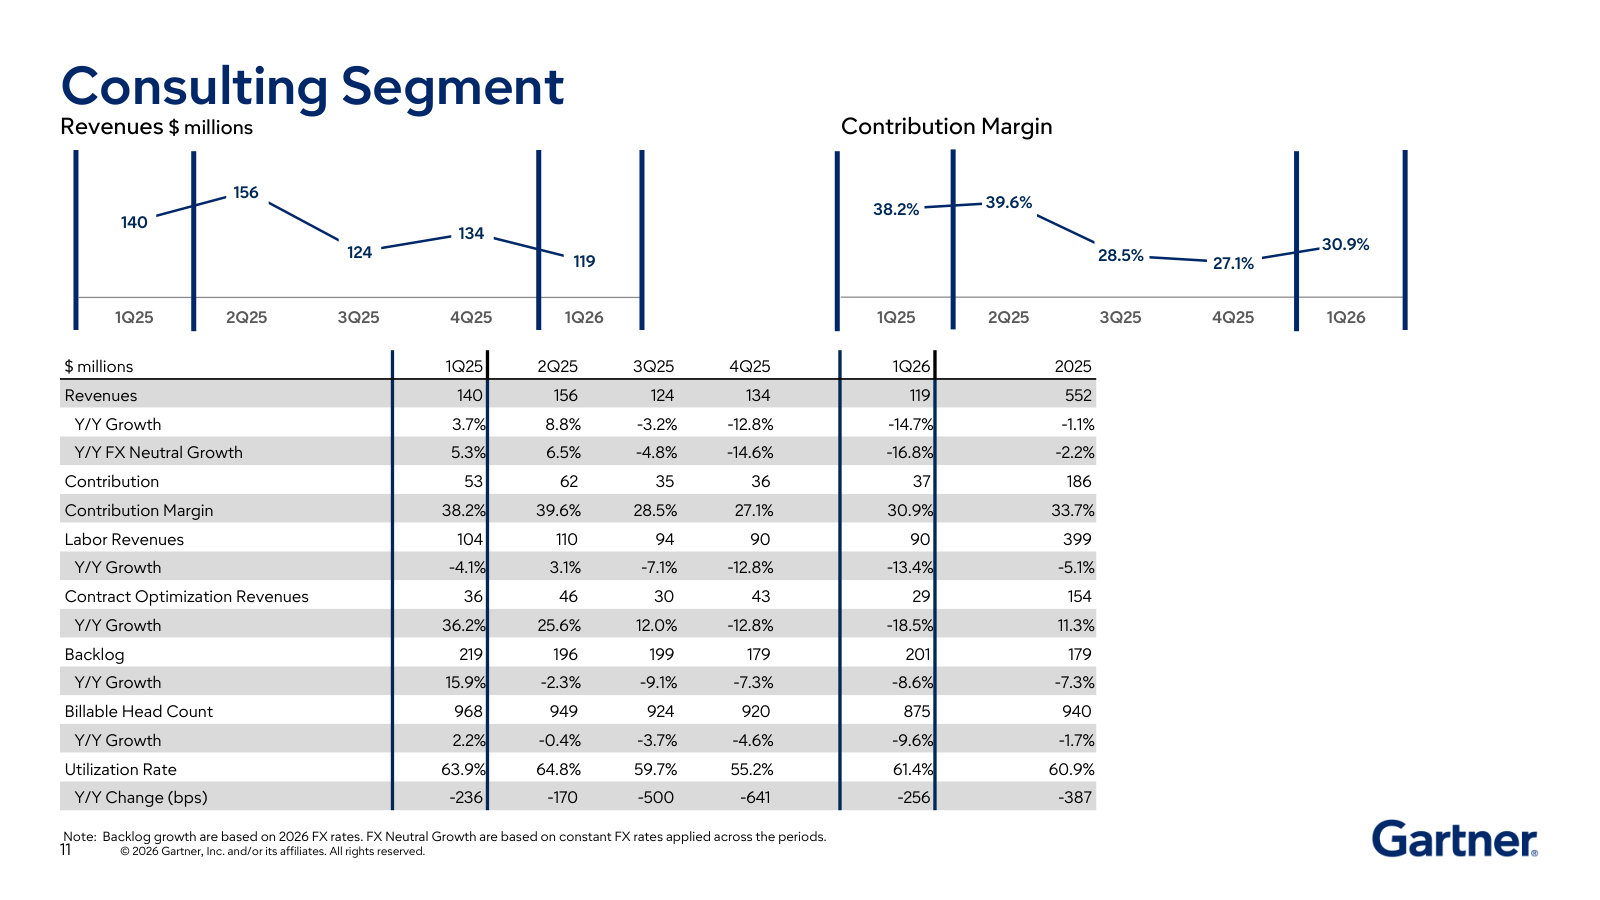
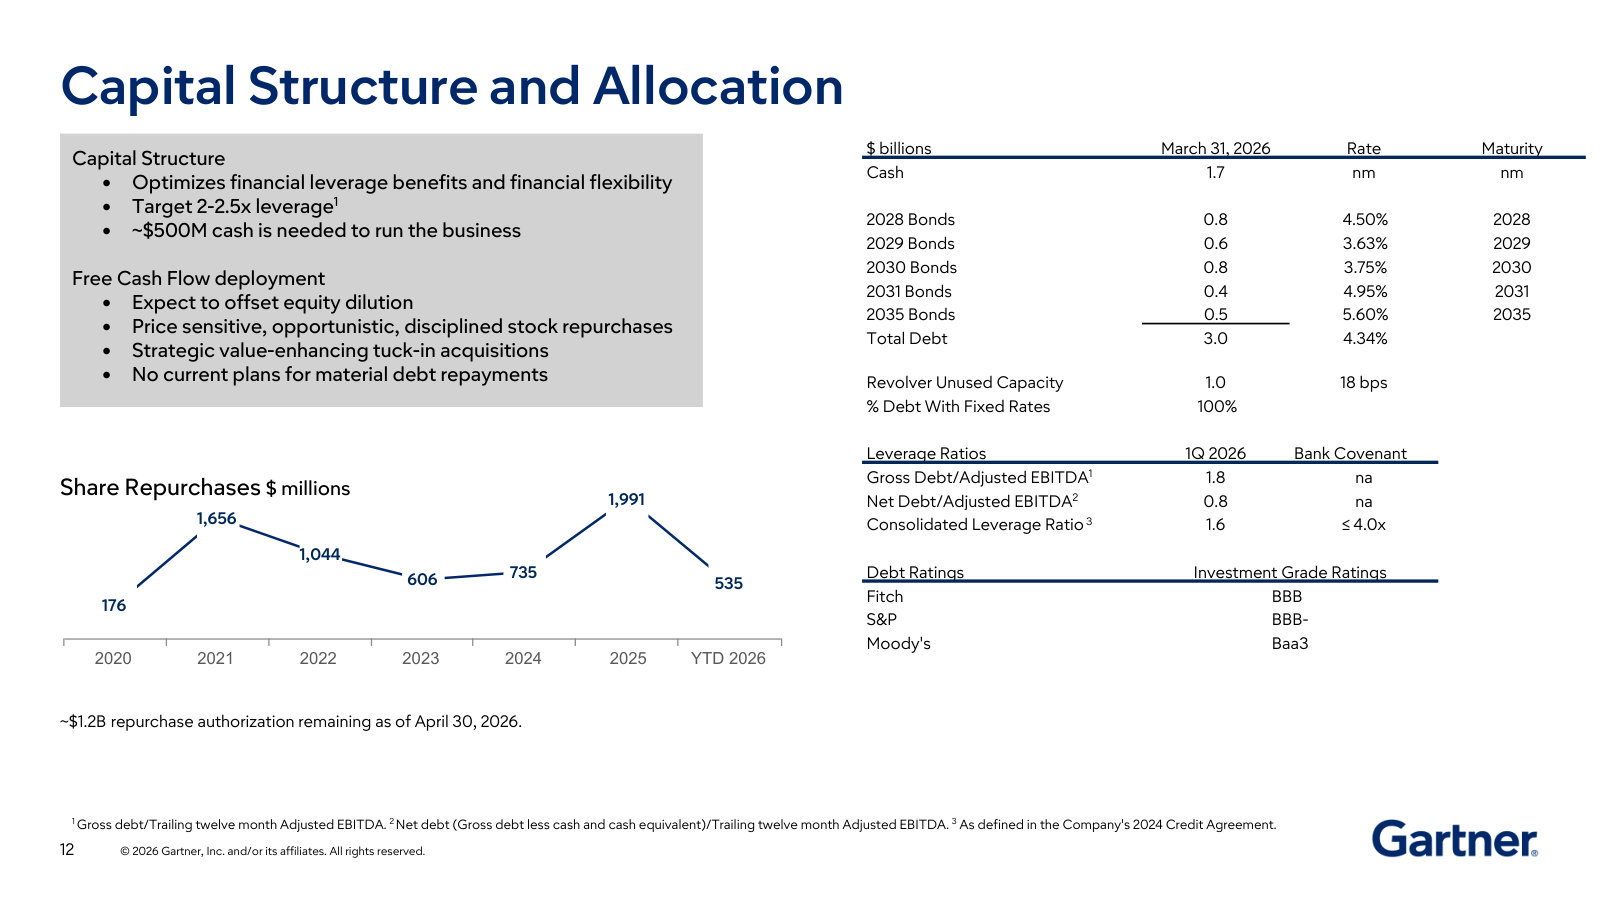
Gartner First Quarter 2026 Results — Q1 2026
Gartner's current earnings deck — its fullest routine explanation of the subscription model, three segments, unit economics and cash flow. · Open the full document →
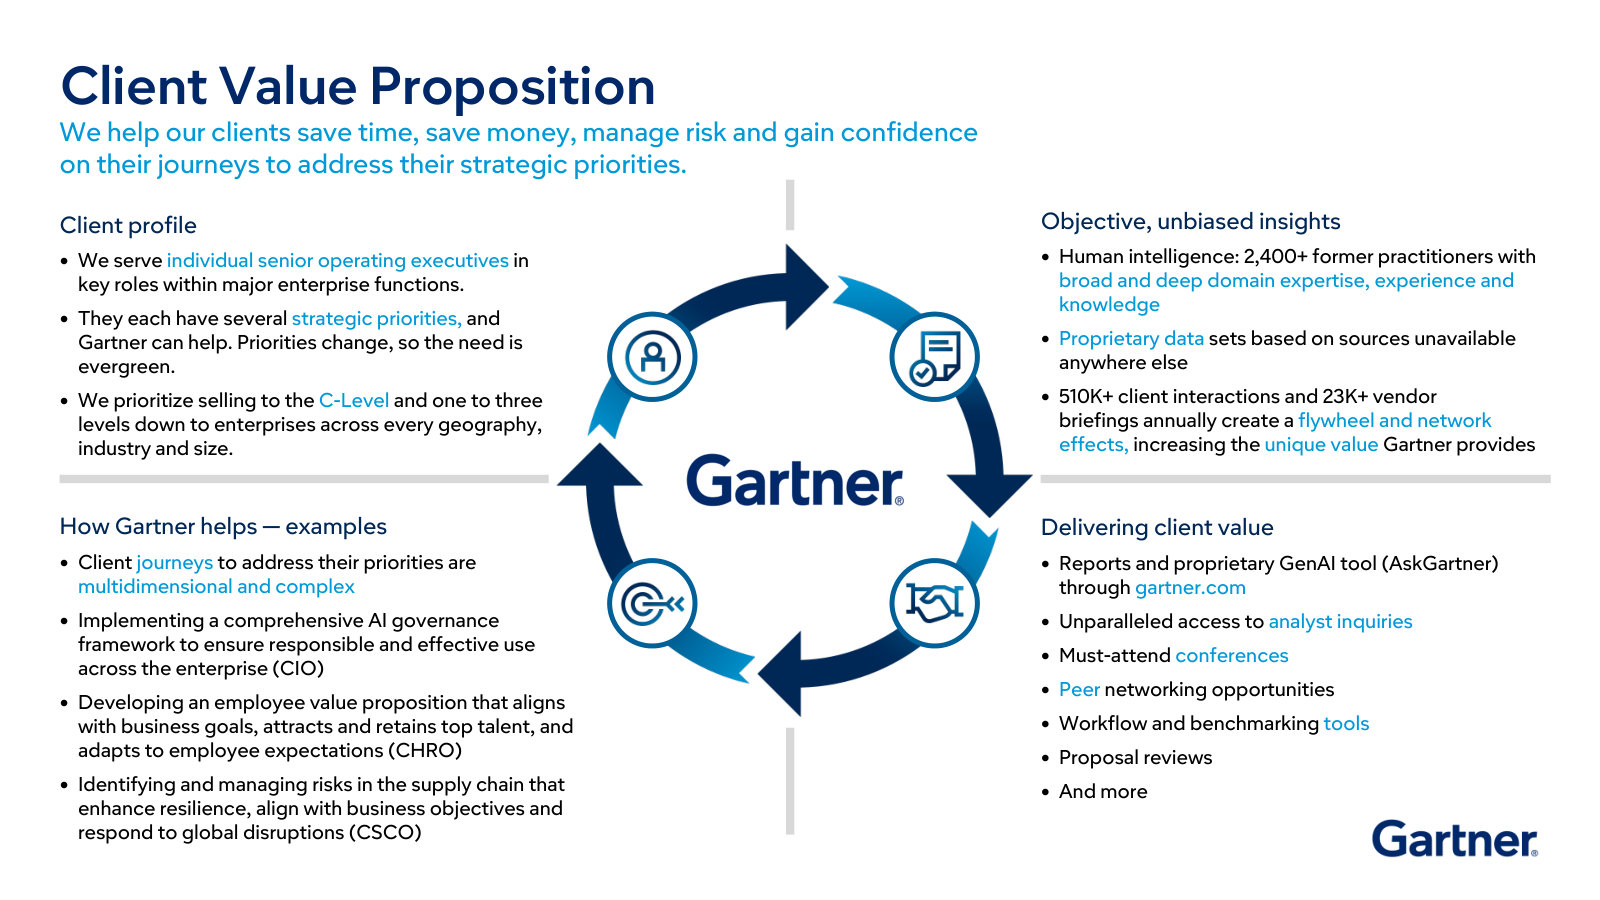
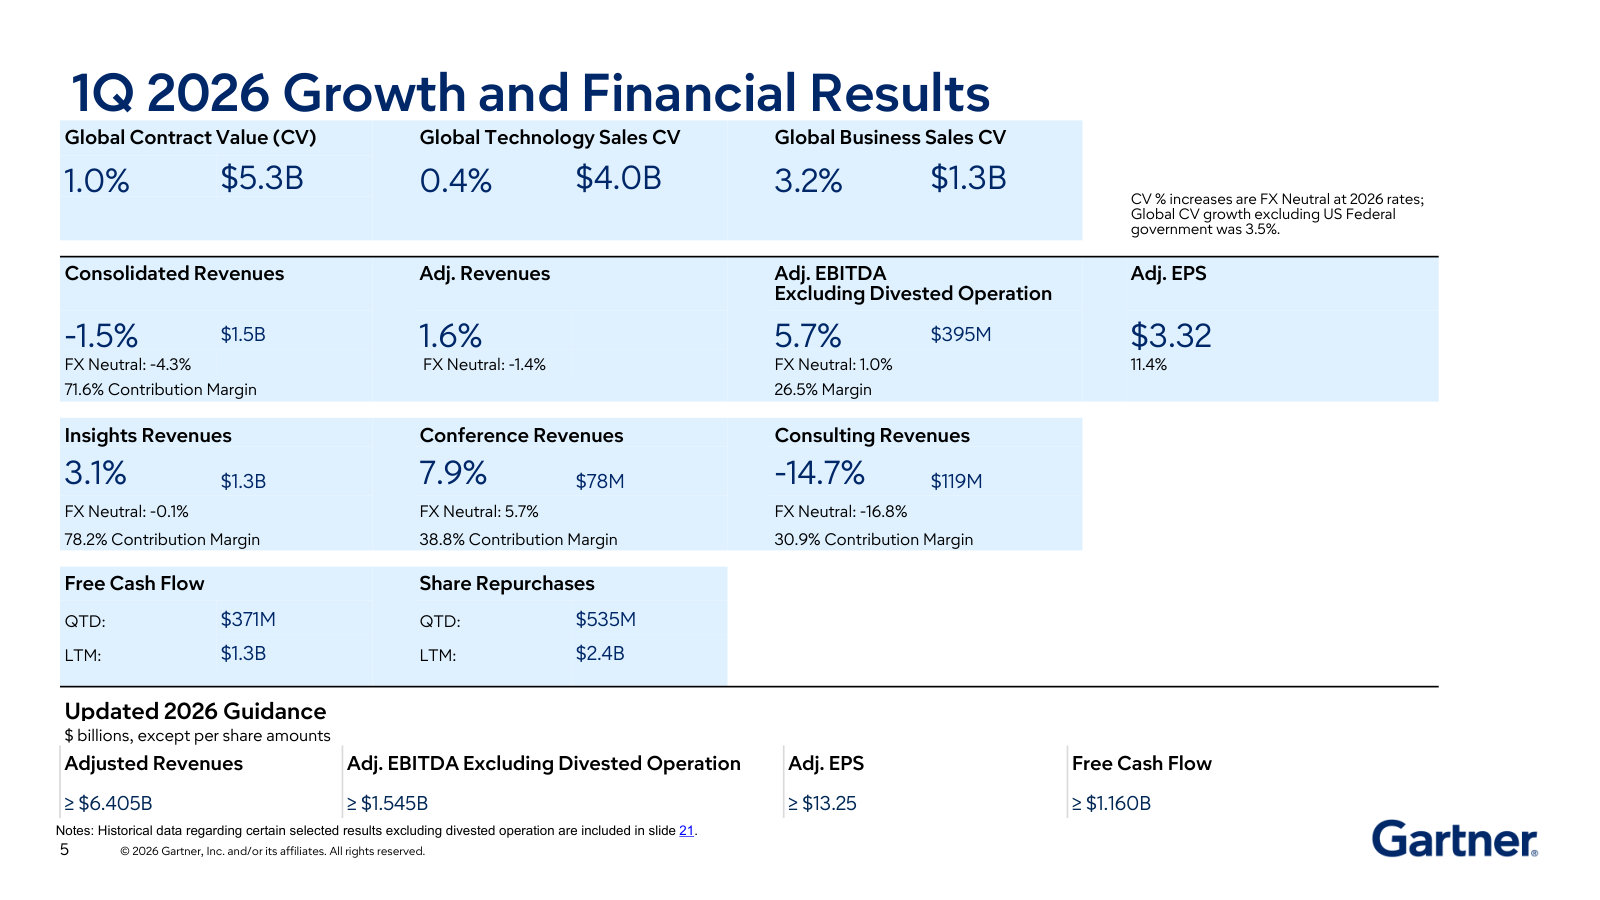
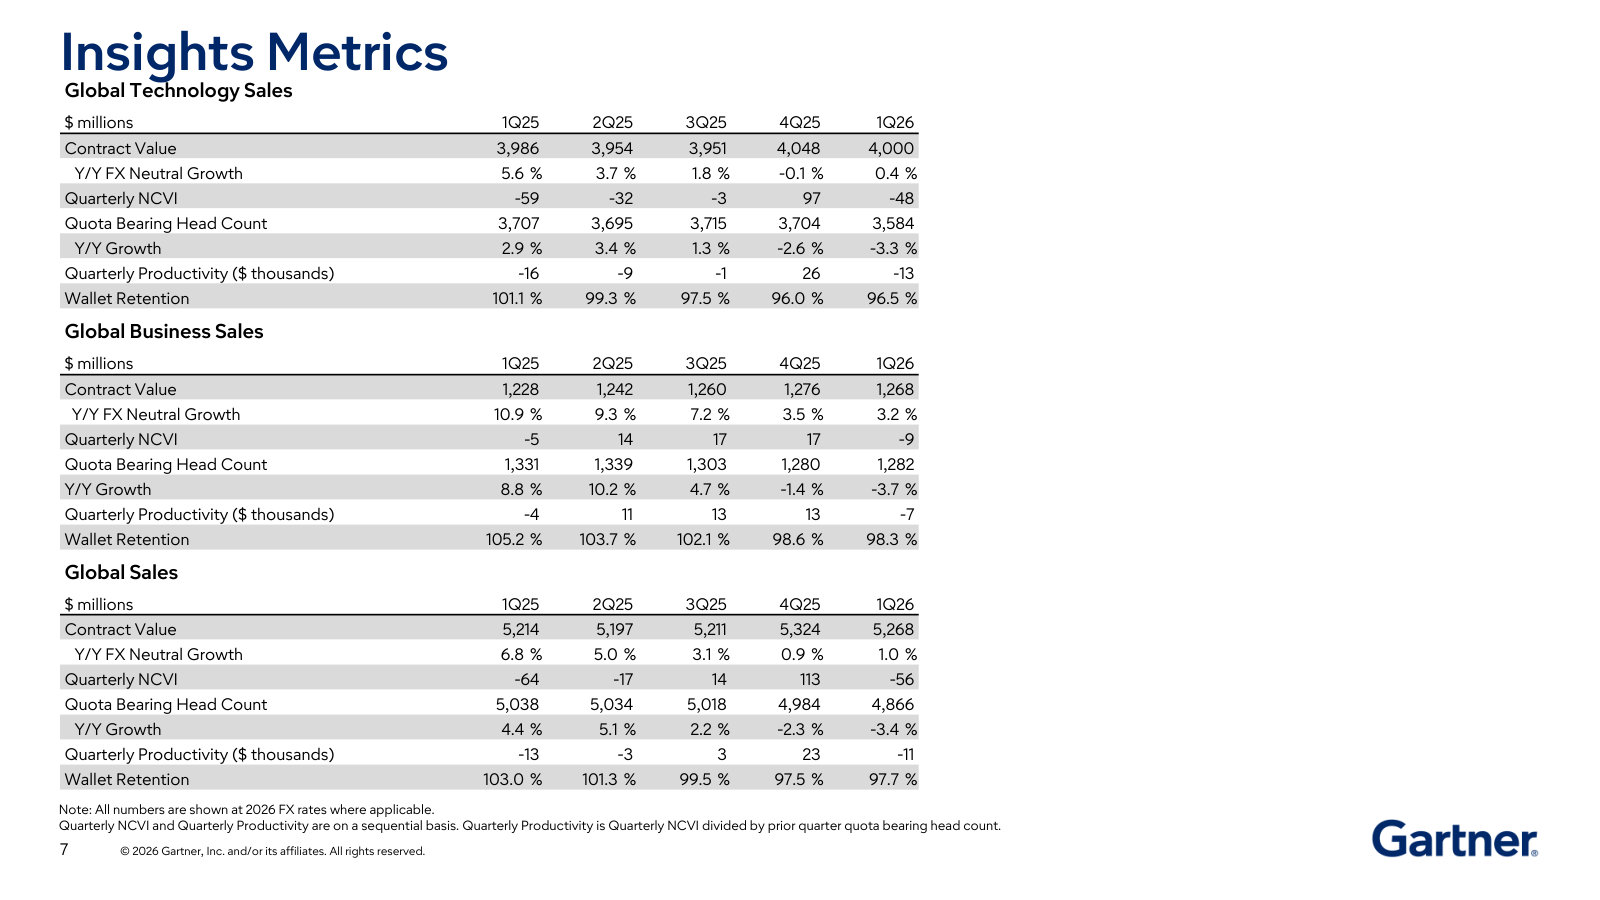
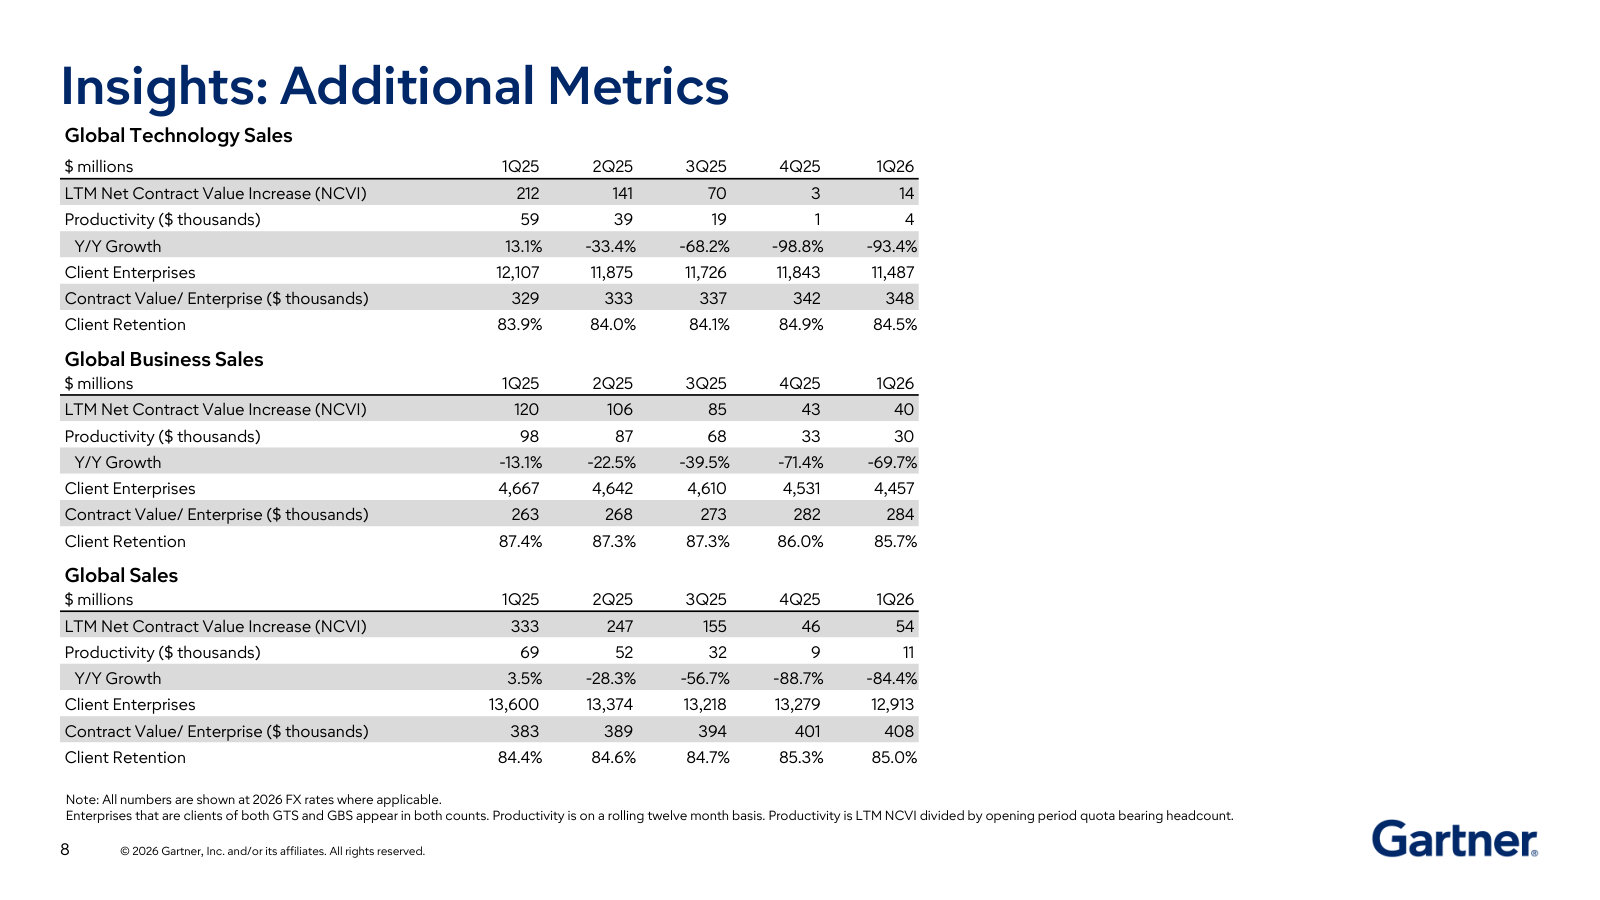
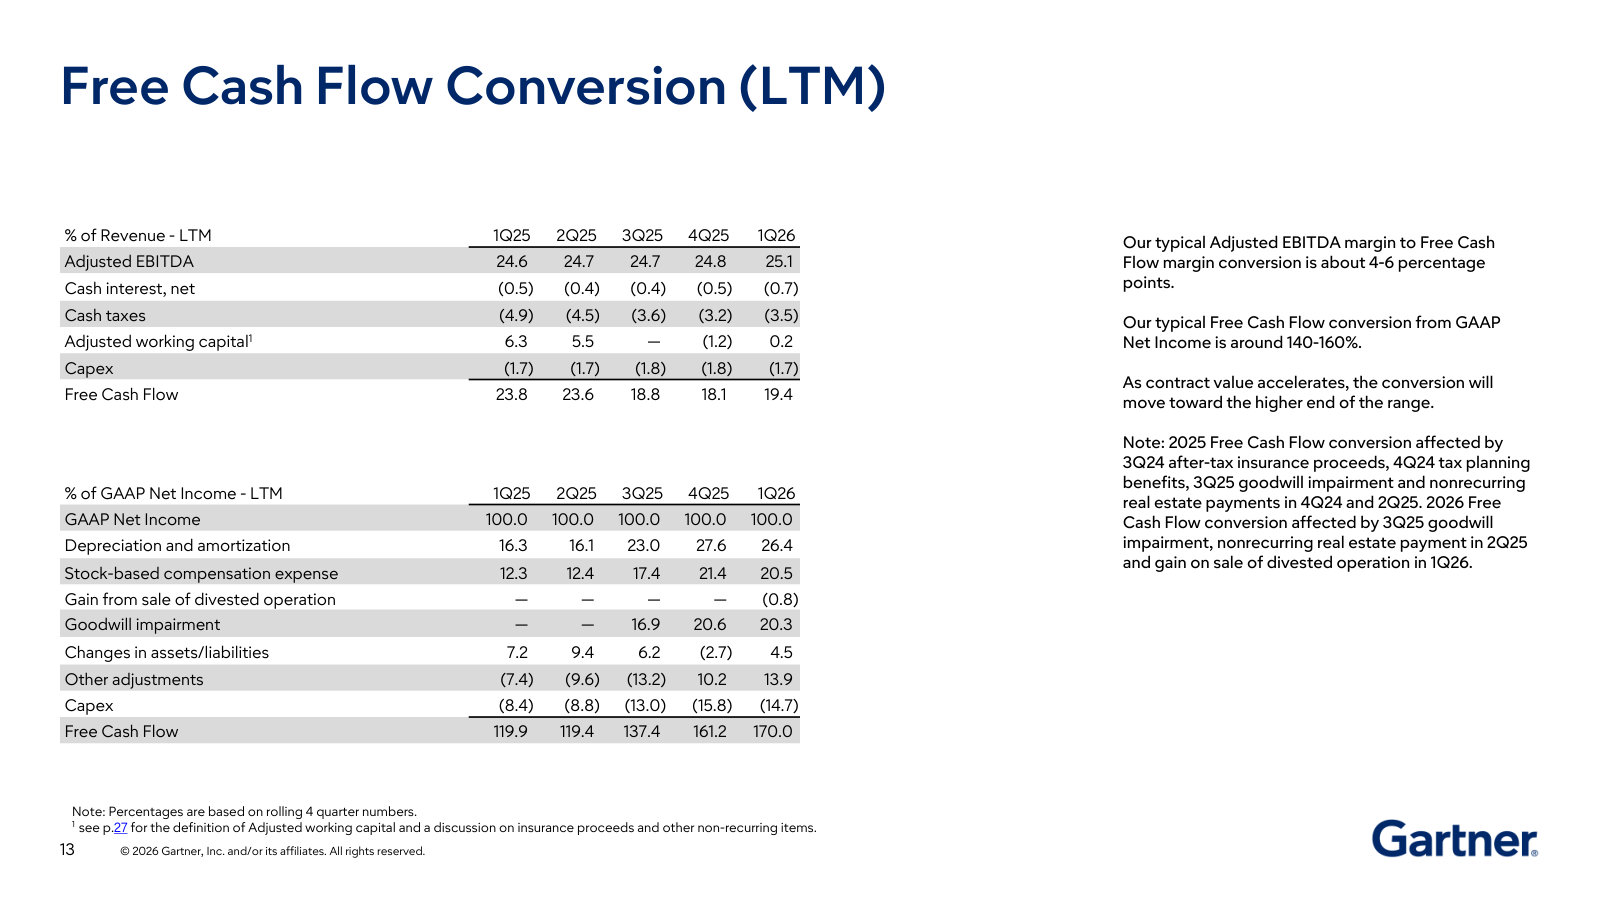
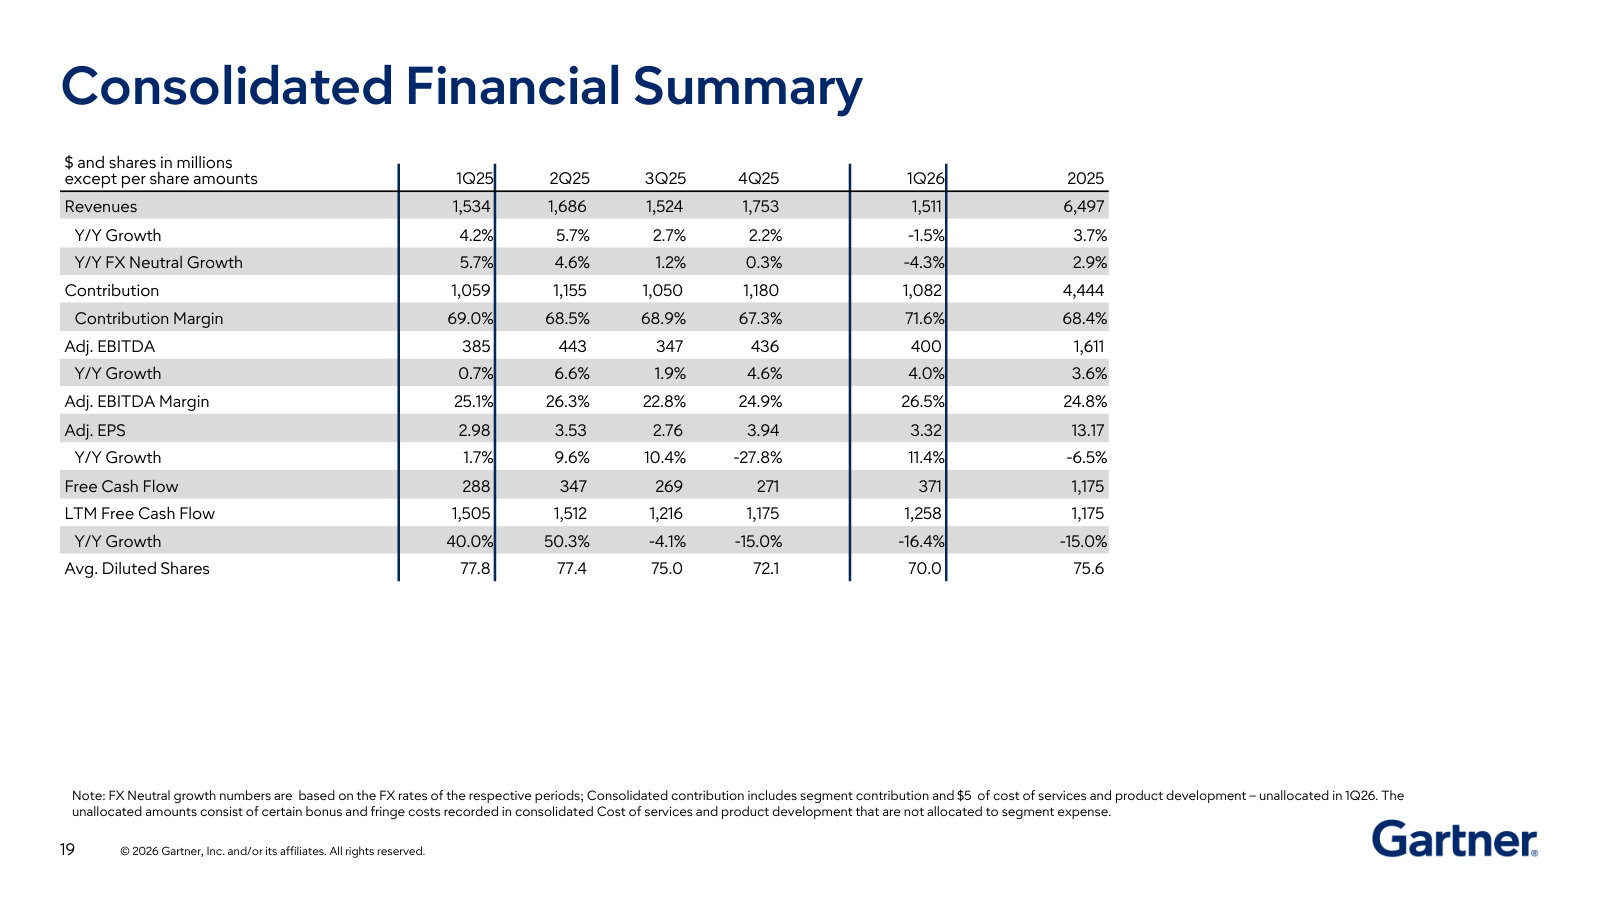
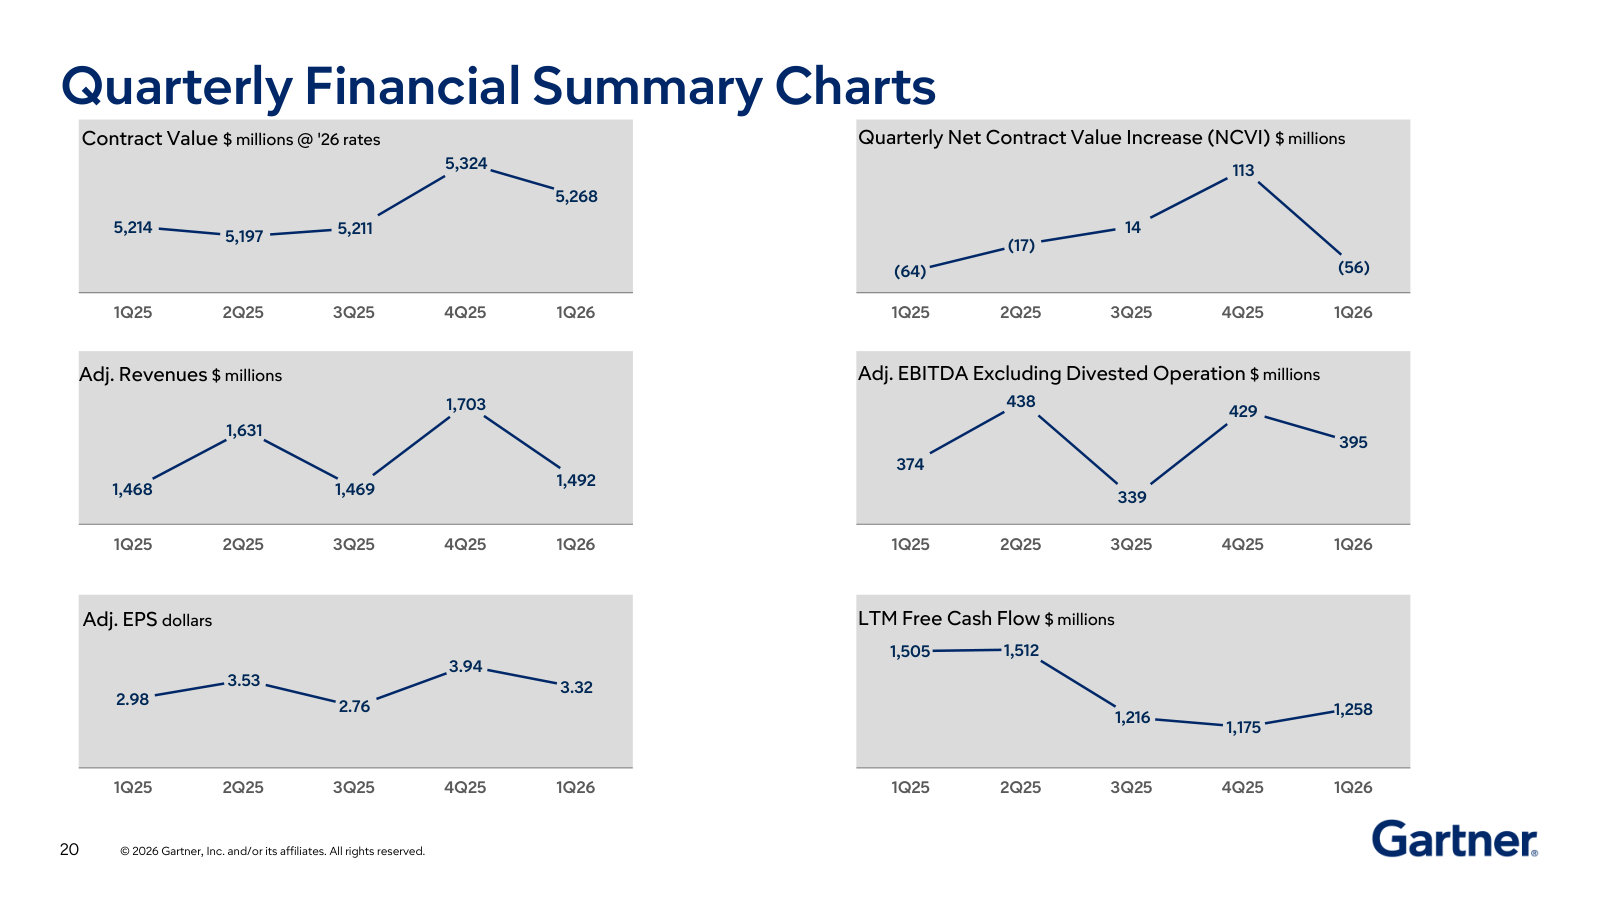
More from management
Gartner Fourth Quarter 2025 Results — FY2025 / Q4 2025 · 33 pages · Full-year 2025 as the headline period — the clean FY2025 segment and cash-flow snapshot, structurally identical to the featured deck. · Open →
Gartner Fourth Quarter 2024 Results — FY2024 · 28 pages · Full-year 2024 results — the prior-year baseline for revenue, segment mix, margins and free cash flow. · Open →
Gartner Fourth Quarter 2023 Results — FY2023 · 28 pages · Full-year 2023 results — an earlier baseline covering the post-pandemic conference recovery. · Open →
Gartner, Inc.'s management answers for the business every quarter. These are the exchanges that explain it best — verbatim, from the call transcripts preserved in Sources. Each link opens the full transcript at that page in a new tab.
Q1 2026 Earnings Call — May 5, 2026
The most recent call: contract value re-accelerating outside U.S. federal, AI framed as a tailwind rather than a threat, and an EPS algorithm leaning hard on buybacks. · Open the full transcript →
Who Gartner sells to — and why those C-suite roles persist through any macro, the structural case for the subscription.
Gene Hall, Chairman & CEO: Our clients are the senior-most executives and their teams who lead every major enterprise function. For example, Chief Information Officers and senior IT leaders, Chief Supply Chain Officers and heads of logistics, Chief Financial Officers and corporate controllers and more. These roles are enduring regardless of change in the world. The executives who lead these roles will always have priorities that are mission critical to the success of their enterprise, their functions and their personal careers.
p. 1 · Read in context →
The proprietary-data moat behind the insights: half a million executive conversations and 27,000 vendor briefings a year.
Gene Hall, Chairman & CEO: Gartner insights are derived from a vast pool of highly proprietary data. Every year, we hold more than 0.5 million two-way conversations with more than 80,000 executives across every major function and in every industry. We conduct more than 27,000 briefings with the executives from technology providers. We also leverage data from proprietary surveys, tools, models, benchmarks and more. This gives us a deep understanding of what executives care about most, what's working and what isn't.
p. 1 · Read in context →
Why price pressure stays muted: Gartner starts at the top of the org chart, where price sensitivity is lowest.
Craig Safian, CFO, responding to Faiza Alwy (Deutsche Bank): And Faiza, it's important to remember who we're targeting and focusing on from a go-to-market and strategy perspective, which is really the top of the org chart in each of the functions we serve. We target the CIO, the CFO or the Chief Supply Chain Officer and their teams. We're starting at the top of the pyramid where there tends to be much less price sensitivity around those services. And again, if there is price sensitivity, there are offerings that we can provide to clients at different service levels.
p. 6 · Read in context →
The DOGE/federal shock, dated and sized: felt from March 2025, leaving $114M of federal CV that now begins to lap.
Craig Safian, CFO, responding to Andrew Nicholas (William Blair): Andrew, on the U.S. Federal side, as we talked about through most of last year, the DOGE impacts, we really didn't start feeling them until March of last year. Jan and Feb were seminormal from a selling environment perspective. When the DOGE activities kicked in, that was really March and April and then forward from there. As we roll into Q2, we start to lap the significant challenges that we had there.
p. 6 · Read in context →
How a low-single-digit CV grower still targets 12% EPS growth: margin expansion plus ~$2.4-2.5bn of annual buybacks.
Craig Safian, CFO, responding to Joshua Chan (UBS): Over a three-year period, our expectation is CV growth will reaccelerate, which will drive future revenue growth. We're committed to driving margin expansion over time as well. On top of that, we have significant capital to deploy for buybacks. […] Our intention is to continue share repurchases, which is one of the bigger drivers of that EPS CAGR in addition to revenue and margin expansion.
p. 9 · Read in context →
Asked whether he'd distribute Gartner's data through third-party LLMs, Hall says proactive, human advisory doesn't fit that model.
Gene Hall, Chairman & CEO, responding to Toni Kaplan (Morgan Stanley): Toni, you're on the nail. Clients rely on us to proactively tell them what they're not seeing, help them see around corners and forecast how the world will evolve so they can be successful. That proactive advisory role doesn't fit well with simply feeding our proprietary data into an LLM that answers questions. There's also a big human component: executive partners, analysts, in-person conferences and peer interaction. Our published content is only a portion of what our analysts know — inquiries and analyst access unlock much more.
p. 9 · Read in context →
Q4 & Full-Year 2025 Earnings Call — February 3, 2026 · annual
The annual strategy call: management reboots the research engine along four dimensions, divests digital markets, and defends the medium-term algorithm against 'disruption is in the air.' · Open the full transcript →
What made 2025 uniquely hard — DOGE, tariffs, funding cuts — and how those forces slowed every buying decision.
Gene Hall, Chairman & CEO: 2025 was a unique year due to a range of external market forces. Department of government efficiency or dose-related initiatives affected our U.S. federal clients. Evolving trade policies created complexity for tariff-impacted enterprises. Funding changes affected our state and local government and education clients; tech companies that are not in or adjacent to AI experienced a shifting landscape. Additionally, there were country-specific factors in several geographies. These external market forces led to increased scrutiny, elevated deal approval authority, and extended buying cycles.
p. 1 · Read in context →
The business model in three sentences: subscription, paid upfront, free cash flow well in excess of net income.
Craig Safian, CFO: The Insight segment is our largest, most important business. It's subscription-based with strong retention, recurring revenue, and excellent contribution margins. We get paid upfront, which allows us to generate strong free cash flow well in excess of net income.
p. 3 · Read in context →
The strategic pivot: assume permanent disruption, sell the non-core digital-markets business, and concentrate on engagement.
Gene Hall, Chairman & CEO, responding to Joshua Chan (UBS): During the first half of last year, we came to the conclusion that we should assume that the world is going to be like this forever—that there's going to be a lot more disruption and chaos. We don't know what those things are going to be, but we need to be prepared for them. So to do that, we decided the best way to impact our business was to focus on our core BTI business. On top of that, and within that, the way to optimize that business is to get more client engagement. As I mentioned in my remarks, the more clients engage with us, the higher the retention is.
p. 8 · Read in context →
The AI-threat metric: sellers log every 'AI instead of Gartner' mention — and management says Q4 saw even fewer.
Gene Hall, Chairman & CEO, responding to Toni Kaplan (Morgan Stanley): One specific concern we ask them to track is if a client mentions using AI as a substitute. In addition to that, we have a help desk; any salesperson can report that a client mentioned considering AI instead of Gartner. […] I should point out that we've faced a lot of challenges with clients in terms of their internal budgets, but one that we do not hear frequently is, 'They're thinking about using AI in some way as a substitute for Gartner.' If anything, Q4 was less of an issue or less confirmed than even before.
p. 9 · Read in context →
The hardest question — 'disruption is in the air, why keep the medium-term targets?' — and Hall's answer.
Surinder Thind (Jefferies); Gene Hall, Chairman & CEO: Gene, could you maybe talk about your willingness to kind of maintain the medium-term guidance here? It seems like we've had a number of challenging years where there's always something that disrupts your ability to hit that medium-term guidance. Given the pace of change, what gives you confidence that you can achieve medium-term guidance? […] Because of that, we needed to significantly increase the value we provide clients. So we have a program in place to do it. I mentioned earlier in the call that early indicators are positive. It will take time because, again, clients need to utilize our insights, then come up for renewal, which takes time.
p. 10 · Read in context →
Q2 2025 Earnings Call — August 5, 2025
The shock call: DOGE guts federal renewals to ~47% dollar retention, tariffs push buying decisions up the org chart, and the AI-cannibalization question gets its bluntest answer. · Open the full transcript →
How Gartner reads a downturn: it tracks the reason for every lost renewal and new-business loss — Q2's biggest was federal.
Gene Hall, Chairman & CEO: We also experienced some headwinds during Q2. Measures of CEO confidence fell to recessionary levels, among the fastest drops ever recorded. And in a Gartner survey, 78% of CEOs indicated they're implementing cost-cutting measures to safeguard performance. We have a high degree of confidence in what caused these headwinds because we track the reason for every loss for both renewals and potential new business. The largest headwind in Q2 was with the U.S. federal government.
p. 1 · Read in context →
The DOGE cliff, sized: barely half the federal dollars renewing, ~$200M of CV still exposed at mid-year.
Craig Safian, CFO: Nearly all of our U.S. federal contracts will come up for renewal during 2025, with over 60% having transacted in the first half of the year. Dollar retention year-to-date was around 47%.
p. 3 · Read in context →
The bridge back to double digits, quantified: ~200bp from lapping federal, ~100bp tariff normalization, ~100bp tech vendors.
Craig Safian, CFO: There are four primary categories, which will drive the return to double-digit growth. First, most of our U.S. federal contracts will have come up for renewal this year. Removing the DOGE-related headwinds with no assumption for net growth next year will add back around 200 basis points of CV growth in 2026. Second, as companies and tariff-affected industries get more clarity around trade policies, we expect them to get back to normal course planning and spending. This should add at least 100 basis points to growth. Third, tech vendor remains on a path back to double digits.
p. 5 · Read in context →
The tariff playbook: routine license decisions get escalated to the CFO/CEO — the same friction Gartner saw in 2009 and 2021.
Gartner management, responding to Toni Kaplan (Morgan Stanley): This year, particularly in Q2, we observed that in industries affected by tariffs, purchase decisions have been escalated. Typically, a Chief HR Officer or a Chief Information Officer has the authority to decide on purchasing additional licenses from Gartner. However, in Q2, we noticed that these decisions were being elevated to the CFO or even the CEO. Clients indicated that this was due to concerns about tariffs impacting their profitability, preventing them from passing on all costs to their clients. As a result, they are implementing significant cost-cutting measures, which is why small purchases are being escalated to higher levels. This pattern is consistent with behavior observed during previous recessions. We saw similar behavior during the pandemic in 2021 and the Great Recession in 2009.
p. 7 · Read in context →
The AI-cannibalization question, answered bluntly: clients citing a public LLM instead of Gartner are 'essentially unmeasurable.'
Jason Haas (Wells Fargo); Gene Hall, Chairman & CEO: Are you able to give us any sense of what percentage of folks are citing usage of like a publicly available large language model and therefore, not consuming the Gartner subscription? Is that coming up at all? What percentage is that? […] Yes, that's one of the options, and it's not significant. It's essentially unmeasurable.
p. 13 · Read in context →
Q4 & Full-Year 2024 Earnings Call — February 4, 2025 · annual
The full-year 2024 call that best explains the model — upfront cash, 100%+ wallet retention, disciplined pricing — and diagnoses the tech-vendor VC bubble that had whipsawed growth. · Open the full transcript →
How land-and-expand shows up: wallet retention above 100% means existing clients grow spend even before new logos.
Craig Safian, CFO: Wallet retention for GTS was 102% for the quarter, reflecting net growth even before the addition of new clients. […] While retention for GBS was 106% for the quarter, reflecting strong net growth with our existing clients, GBS new business was up 15% compared to last year.
p. 3 · Read in context →
The federal exposure before the storm: ~$270M (5% of CV), nearly all one-year contracts — the base DOGE would hit in 2025.
Craig Safian, CFO: Our contracts are spread widely across agencies and departments. Around 85% of U.S. Federal CV is in GTS. Almost all the U.S. federal contracts are for 1 year with renewal spread across the year.
p. 4 · Read in context →
The medium-term algorithm: 12-16% CV growth drives double-digit revenue, modest margin gains, and FCF at least as fast as EBITDA.
Craig Safian, CFO: With 12% to 16% Research CV growth, we will deliver double-digit revenue growth. With gross margin expansion, sales costs growing about in line with CV growth and G&A leverage, we will expand EBITDA margins modestly over time. We can grow free cash flow at least as fast as EBITDA because of our modest CapEx needs and the benefits of our clients paying us upfront.
p. 5 · Read in context →
The tech-vendor whipsaw, diagnosed: a 3-4x VC funding bubble inflated then deflated demand — 'I don't anticipate it happening again.'
Gene Hall, Chairman & CEO, responding to Surinder Thind (Jefferies): The last few years have been quite remarkable for the tech sector. Venture capital funding surged significantly during this time, increasing by about three to four times. I believe there was an exceptionally large bubble in venture capital spending, which in turn created a bubble among tech companies. I don't recall such a situation occurring before, and I don't anticipate it happening again. While anything is possible, this was certainly unusual. In the two decades prior, we experienced fluctuations, but nothing on this scale.
p. 9 · Read in context →
Pricing philosophy: a sub-4% annual increase set by product, geography and — above all — local wage inflation.
Craig Safian, CFO, responding to Jeff Silber (BMO Capital Markets): Jeff, so the price increase for the most part goes into effect, as you said, on November 1. On average, it was a little bit below 4%. But we don't paint it with a broad paint brush. We actually look at it specifically by product and by geography. And so in markets that are more inflationary, we will be more aggressive on pricing. And again, one of the key inputs that we look at is wage inflation in the given markets as well because as we've talked about, philosophically, we want to make sure that our pricing at least offsets what our expectation is from a wage inflation perspective, so it is not a broad paint brush, we're actually very laser-focused on making sure that we're taking the pricing up the right amount, in the right places, in the right currencies.
p. 11 · Read in context →
More calls
Q3 2025 Earnings Call — November 4, 2025 · 12 pages · The quarter before the transformation reveal: engagement and conference NPS presented as leading indicators of future retention, with early signs tariff-hit industries were stabilizing. · Open →
Q1 2025 Earnings Call — May 6, 2025 · 12 pages · Where the federal/DOGE shock first broke into results — the initial read on renewal timing, ~50% dollar retention and roughly $225M of exposed federal CV. · Open →
Q3 2024 Earnings Call — November 5, 2024 · 10 pages · The 'contract value turned the corner' quarter — a clear walk-through of the CV-to-revenue flywheel and why new sales hires take ~3 years to reach full productivity. · Open →
Q1 2024 Earnings Call — April 30, 2024 · 12 pages · The quarter management called the tech-vendor bottom and explained the enterprise-leader vs. tech-vendor split — and why AI was substituting for, not adding to, research demand. · Open →
Q4 & Full-Year 2023 Earnings Call — February 6, 2024 · annual · 15 pages · The full-year 2023 call that laid out the subscription model — 75%+ of revenue, 70%+ multiyear contracts — and the first full in-person conference year, as the GenAI-threat debate peaked. · Open →
Q3 2023 Earnings Call — November 3, 2023 · 12 pages · After the 2022 over-hiring, the call on sales-force tenure as the coiled spring for productivity, plus management's framing of 'low-20s' structural EBITDA margins. · Open →
Q2 2023 Earnings Call — August 1, 2023 · 11 pages · The non-subscription lead-gen cliff explained — why a $70M guidance cut sat almost entirely outside the durable subscription base, and how wallet retention holds ex-tech-vendor. · Open →
Gartner, Inc.'s annual reports contain management's most considered account of the business. These are the sections, passages and visual pages worth opening in the originals preserved in Sources.
Gartner, Inc. — FY2025 Annual Report (Form 10-K) — FY2025
The latest 10-K: the Research→Insights rename, the Digital Markets carve-out and sale, and the first contract-value stall in years. · Open the full document →
Item 1. Business — p. 4 · Read the full section →
How Gartner makes money: three segments — Insights, Conferences, Consulting — on non-cancelable annual subscriptions, 77% multi-year.
Three reportable segments, with Research renamed Business and Technology Insights in Q2 2025.
Gartner delivers its products and services globally through three reportable segments – Business and Technology Insights, Conferences and Consulting […] In the second quarter of 2025, we renamed our segment previously referred to as Research to Business and Technology Insights (or “Insights”) to reflect the nature of the value we provide to clients.
p. 4 · Read in context →
Subscription mechanics: twelve-month minimum term, and 77% of Insights contracts were multi-year at year-end 2025.
Clients normally sign subscription contracts that provide access to our content and advisory services for individual users over a defined period. We typically have a minimum contract period of twelve months for our insights subscription contracts and, at December 31, 2025, 77% of our contracts were multi-year.
p. 6 · Read in context →
Item 1A. Risk Factors — p. 12 · Read the full section →
The company-specific risks that could bite: AI/LLMs substituting for Gartner research, and dependence on renewals (~78% of revenue).
Renewal dependence: subscription products were ~78% of 2025 revenue; a slip in renewals flows straight to the top line.
Our Insights business depends on renewals of subscription-based services and sales of new subscription-based services for a significant portion of our revenue, and our failure to renew at historical rates or generate new sales of such services will lead to a decrease in our revenues. […] These products and services constituted approximately 78% and 77% of total revenues from our operations for 2025 and 2024, respectively.
p. 14 · Read in context →
Item 7. MD&A — Recent Developments — p. 39 · Read the full section →
Management's own account of what hurt 2025: a collapse in US-federal contract value and a $150m Digital Markets goodwill impairment.
Item 7. MD&A — Business Measurements — p. 41 · Read the full section →
Defines the KPI that runs the story — Contract Value — plus client and wallet retention, the leading indicators of the subscription base.
Contract Value defined: annualized value of all subscription contracts in effect — the signal of long-term subscription health.
Contract value represents the dollar value attributable to all of our subscription-related contracts. It is calculated as the annualized value of all contracts in effect at a specific point in time, without regard to the duration of the contract. […] Comparing contract value year-over-year not only measures the short-term growth of our business, but also signals the long-term health of our Insights subscription business since it measures revenue that is highly likely to recur over a multi-year period.
p. 41 · Read in context →
Item 7. MD&A — Segment Results: Insights — p. 51 · Read the full section →
The core engine up close: contract-value growth stalled to +1% and wallet retention fell to 96% (GTS) as clients spent less.
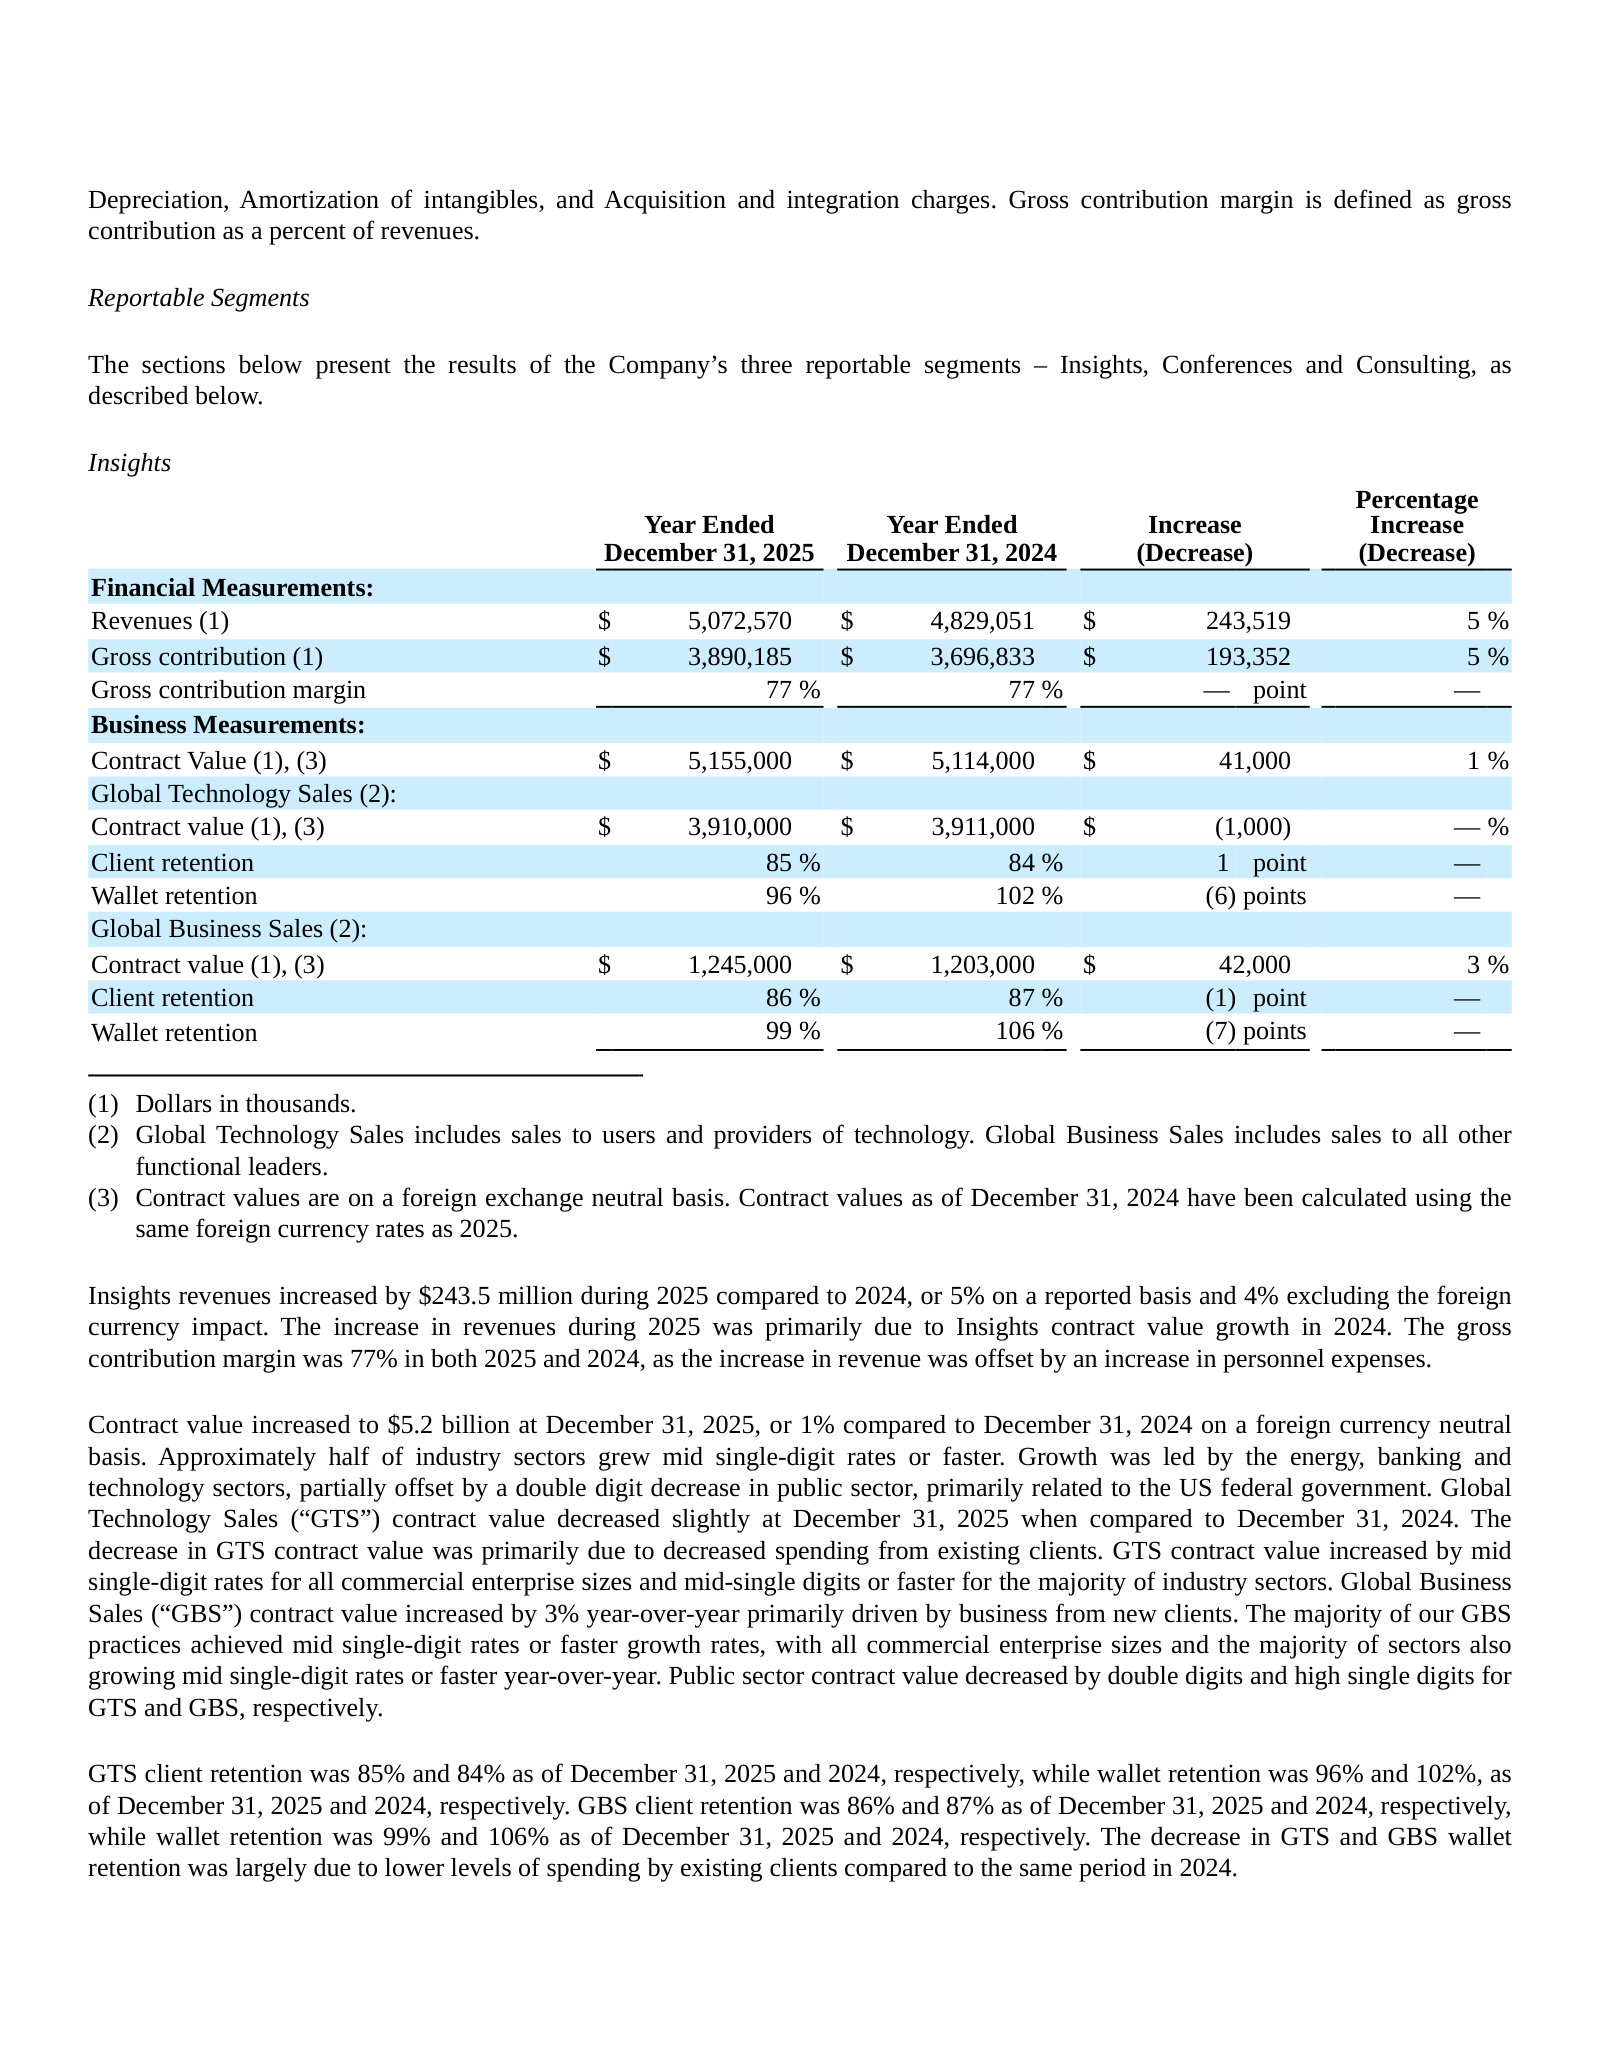
Why CV barely grew: public-sector/US-federal declines offset mid-single-digit gains elsewhere; retention fell on lower spend.
Contract value increased to $5.2 billion at December 31, 2025, or 1% compared to December 31, 2024 on a foreign currency neutral basis. Approximately half of industry sectors grew mid single-digit rates or faster. Growth was led by the energy, banking and technology sectors, partially offset by a double digit decrease in public sector, primarily related to the US federal government. […] The decrease in GTS and GBS wallet retention was largely due to lower levels of spending by existing clients compared to the same period in 2024.
p. 51 · Read in context →
Note 9 — Revenue and Related Matters — p. 101 · Read the full section →
The accounting policy that defines the model: Insights fees are billed up front, deferred, and recognized ratably over the contract.
Subscription revenue recognized ratably; contracts generally non-cancelable, billed amounts booked as deferred revenue.
Insights revenues are derived from subscription contracts for insights products, representing substantially all of the segment’s revenue. The related revenues are deferred and recognized ratably over the applicable contract term (i.e., as services are provided over the contract period). […] Insights contracts are generally non-cancelable and non-refundable, except for government contracts that may have cancellation or fiscal funding clauses, which have not historically resulted in material cancellations. When a subscription contract is invoiced, the Company records the billable amount as a fee receivable, representing its legally enforceable right to payment. The corresponding amount is recognized as deferred revenue until the underlying services are provided and control is transferred to the customer.
p. 101 · Read in context →
Gartner, Inc. — FY2024 Annual Report (Form 10-K) — FY2024
Shown for one reason: the segment was still called 'Research' and Digital Markets sat inside it — the 'before' of the 2025 recast. · Open the full document →
Item 1. Business — p. 4 · Read the full section →
The 'before': in FY2024 the segment was named Research, built on ~2,500 research experts — renamed Business and Technology Insights in 2025.
FY2024's 'RESEARCH.' segment description — the framing Gartner replaced with 'Insights' the following year.
RESEARCH. Gartner delivers independent, objective insight to leaders across an enterprise through subscription services that include on-demand access to published research content, data and benchmarks, and direct access to a network of more than 2,500 research experts located around the globe. […] Gartner research is the fundamental building block for all Gartner products and services. We combine our proprietary research methodologies with extensive industry and academic relationships to create Gartner products and services that address each role across an enterprise.
p. 6 · Read in context →
More annual reports
Gartner, Inc. — FY2023 Annual Report (Form 10-K) — FY2023 · 128 pages · FY2023 10-K — Research/Conferences/Consulting structure pre-rename; a baseline for contract-value and retention trends. · Open →
Gartner, Inc. — FY2022 Annual Report (Form 10-K) — FY2022 · 127 pages · FY2022 10-K — post-pandemic normalization, with conferences returning toward in-person scale. · Open →
Gartner, Inc. — FY2021 Annual Report (Form 10-K) — FY2021 · 135 pages · FY2021 10-K — earliest edition on file; the pandemic-era conferences trough and the recovery setup. · Open →
Competitors describe Gartner, Inc.'s market in their own filings and calls. These verified passages and visual pages show where their strategies meet, using source documents preserved in Sources.
Forrester Research (FORR)
The only pure-play direct competitor to Gartner's core Research franchise — an independent research and advisory firm that names Gartner in its 10-K and reports the same recurring subscription contract-value metric.
Forrester's 10-K names Gartner as a principal direct competitor in research and advisory services.
Our principal direct competitors include other independent providers of research and advisory services, such as Gartner, as well as marketing agencies, general business consulting firms, and survey-based general market research firms.
p. 8 · Read in context →
Forrester's 'contract value' — the recurring research-subscription metric Gartner also reports — fell 6% to $292.4 million in 2025, from $311.9 million a year earlier.
We track contract value as a significant business indicator. Contract value is defined as the value attributable to all of our recurring research-related contracts.
p. 8 · Read in context →
Forrester's CEO reframes the firm as 'the leading AI research company' and adviser as AI reshapes demand for syndicated research.
George F. Colony, Chief Executive Officer: Between our extensive coverage of AI and Izola, we believe that we are the leading AI research company, positioning the company to be the leading adviser to our clients as they use AI to win, serve, and retain customers.
p. 3 · Read in context →
Information Services Group (ISG) (III)
Brands itself a technology research and advisory firm; its ISG Research, benchmarking and sourcing-advisory lines collide directly with Gartner's Research and Consulting segments.
ISG's self-description as a technology research and advisory firm serving 900+ clients, including 75 of the world's top 100 enterprises.
Information Services Group, Inc. (Nasdaq: III) is a global AI-centered technology research and advisory firm. A trusted partner to more than 900 clients, including 75 of the world's top 100 enterprises, ISG is a long-time leader in technology and business services sourcing that is now focused on leveraging AI to help organizations achieve operational excellence and faster growth.
p. 7 · Read in context →
ISG's competition section places 'research firms' and 'strategy consultants' in its market alongside benchmarking data as a basis of competition.
Competition in the sourcing, data, information and advisory market is primarily driven by independence and objectivity, expertise, possession of relevant benchmarking data, breadth of service capabilities, reputation and price. We compete with other sourcing advisors, research firms, strategy consultants and sourcing service providers.
p. 15 · Read in context →
ISG Research's benchmarking base — 180,000 tracked contracts and 4,000+ providers evaluated a year — the data-and-provider-evaluation role Gartner also sells.
ISG tracks over 180,000 unique technology service contracts and measures and writes about more than 4,000 service and software providers each year. This gives us valuable insights into pricing, capabilities and stability. When large enterprises need to evaluate providers, they reach out to ISG Research for a deep understanding of capabilities, pricing, breadth of coverage and past experience.
p. 13 · Read in context →
Accenture (ACN)
The largest technology-strategy and advisory competitor to Gartner Consulting; a scale player advising enterprises on AI and reinvention.
Accenture's stated role advising clients on what AI to deploy and when — the technology-advisory function that overlaps Gartner Consulting.
Julie Sweet, Chief Executive Officer: We play a critical role in the AI-ecosystem. Foundation models provide the “intelligence”; and our role is helping clients understand what to deploy and when, how to integrate it into their systems, reimagine their processes, modernize their data and digital core, help redesign their operating models and do effective change management, and help build the capabilities and talent needed to scale AI across the enterprise.
p. 8 · Read in context →
Accenture's stated $240 billion mid-market addressable market (companies with $300 million–$3 billion of revenue) as it extends enterprise technology advisory to smaller companies Gartner also serves.
Julie Sweet, Chief Executive Officer: We are also expanding our total addressable market by going after a new, exciting customer segment: the mid-market.
p. 5 · Read in context →
Huron Consulting Group (HURN)
A management- and digital-consulting firm whose technology-strategy, ERP and AI advisory overlaps Gartner Consulting's engagements.
Huron's digital/technology advisory reached 41% of company revenue (RBR) in 2025.
C. Mark Hussey, Chief Executive Officer: Our digital capability, which represented 41% of total company RBR in 2025, remains a differentiated partner to our clients in a large growing market.
p. 3 · Read in context →
Huron frames AI-strategy and modernization advisory as an expansion of its addressable market.
C. Mark Hussey, Chief Executive Officer: We also see AI as an opportunity to grow our addressable market as we continue to invest in and sell our AI-focused services and solutions, which range from AI strategy and data modernization to implementation, orchestration, and change management.
p. 4 · Read in context →
More peer documents
III_annual_report_FY2025 — 127 pages · ISG's latest 10-K — updated positioning, ISG Research Lens/Tango platforms and recurring-revenue mix. · Open →
Q1_FY2026 — 7 pages · CEO ties growth to research and recurring revenue and quantifies the more than $200bn of tech spend ISG influences a year. · Open →
ACN_annual_report_FY2025 — 103 pages · Accenture's Reinvention Services and Strategy & Consulting scope — the segment that competes with Gartner Consulting. · Open →
HURN_annual_report_FY2025 — 178 pages · Huron's Digital segment detail and formal competition section for the technology-advisory overlap. · Open →
Q4_FY2025 — 9 pages · Forrester's FY2025 wrap-up — reshaping consulting/events around the higher-margin subscription-research core. · Open →
Q1_FY2026 — 23 pages · Accenture management on AI/reinvention advisory demand and taking market share. · Open →
FCN_annual_report_FY2024 — 103 pages · FTI's competition section defines rivals as restructuring/e-discovery/economics firms, not research/advisory — evidence its Gartner overlap is marginal. · Open →
CRAI_annual_report_FY2026 — 125 pages · CRA's Management Consulting scope, to confirm its litigation/economics core barely overlaps Gartner Consulting. · Open →
The Subscription Engine
Gartner sells subscription research to corporate leaders, mostly technology executives. That business, renamed Insights in 2025, supplies 78% of the company's $6.5 billion in revenue and roughly 90% of segment profit, and converts sales to cash unusually well. After a decade of compounding lifted the stock more than fivefold, core contract value has stalled and the shares now sit about 75% below their 2025 peak. This report works through whether that stall is cyclical or structural.
What Gartner sells
Gartner delivers its products through three reportable segments: Business and Technology Insights, Conferences, and Consulting [1]. Insights — the segment the company called Research until it renamed it in the second quarter of 2025 — is the engine [2]. It sells on-demand access to published research, data and benchmarks, and to a network of more than 2,400 analysts and experts, through subscription contracts that are mostly paid in advance [3].
Within Insights, the company splits its sales force in two: Global Technology Sales (GTS) sells to users and providers of technology, and Global Business Sales (GBS) sells to every other functional leader — human resources, supply chain, finance, marketing [4]. GTS is roughly three times the size of GBS by contract value, so the technology-buyer base is where the case is most concentrated. Conferences runs Gartner's in-person events (53 destination conferences in 2025); Consulting does project-based advisory and benchmarking [5]. The company employed 20,244 people across 40 countries at the end of 2025 [6].
Revenue FY2025 ($M)
Insights % of Revenue
Operating Margin
Operating Cash Flow ($M)
Sources: FY2025 Annual Report, Results of Operations [7] and Executive Summary [8].
The three segments are not equal contributors. Insights produced $5.07 billion of the $6.50 billion 2025 revenue; Conferences $645 million and Consulting $552 million made up most of the rest [9]. On profit the concentration is starker: Insights carried a 77% gross-contribution margin and delivered $3.89 billion of segment gross contribution, against $323 million from Conferences and $186 million from Consulting [10]. Nearly nine of every ten dollars of segment profit come from the subscription business.
Sources: FY2025 Annual Report, segment revenues [11]; segment gross contribution [12].
A decade of compounding
Gartner grew from $2.4 billion of revenue in 2016 to $6.5 billion in 2025. A 2017 acquisition of CEB Inc. stepped the company up in size — and left a real-estate and integration overhang that pushed operating income to break-even that year — after which the business compounded organically through the pandemic dip of 2020 [13]. Operating income rose alongside revenue, peaking near 21% of sales in 2023.
Source: derived from reported financials, FY2016–FY2025 Forms 10-K; FY2023–FY2025 figures per the Consolidated Statements of Operations [14].
The chart shows the shift the headline earnings do not. Operating income rolled over after 2023: it fell 11% in 2025 to $1,026 million, and operating margin compressed from 20.9% (2023) to 18.4% (2024) to 15.8% (2025) even as revenue kept rising [15]. The main driver was selling, general and administrative expense growing 6% against 4% revenue growth — the company spending more on its sales force as growth slowed [16].
Reported net income tells a noisier story and should be read with care. It fell to $729 million in 2025 from $1,254 million in 2024, but the swing is dominated by one-off items: a $300 million gain on event-cancellation insurance claims lifted 2024, while 2025 absorbed a $150 million goodwill impairment and a higher tax provision [17]. Diluted EPS of $16.00 in 2024 and $9.65 in 2025 both carry that distortion; the operating line is the cleaner read of the underlying business [18].
What has not weakened is cash generation. Because most Insights contracts are paid in advance, working capital funds growth rather than consuming it, and operating cash flow was $1.3 billion in 2025 against $729 million of net income [19]. Management has returned that cash almost entirely through buybacks: it repurchased 7.0 million shares for roughly $2.0 billion in 2025, and diluted share count has fallen from 92 million in 2018 to 75.6 million [20] [21]. The board has authorized more than $7 billion of repurchases since 2015, adding $500 million in January 2026 [22].
Source: derived from reported financials, FY2018–FY2025 Forms 10-K; 2025 repurchases per Executive Summary [23].
The engine has stalled
Gartner's own preferred measure of the subscription business is contract value — the annualized value of all subscription contracts in effect at a point in time. The company describes it as a signal of "the long-term health" of the business, because it measures revenue "highly likely to recur over a multi-year period" [24]. By that measure, the core engine has stopped growing.
GTS contract value — the technology-buyer base, and the larger half — was $3,910 million at the end of 2025, essentially flat against $3,911 million a year earlier and down slightly in dollar terms [25]. GBS contract value still grew, to $1,245 million from $1,203 million (up 3%), leaving total contract value up just 1% [26].
Source: FY2025 Annual Report, Insights Segment business measurements [27]; prior years per FY2020–FY2024 Forms 10-K.
The sharper signal sits in wallet retention — the share of a year-ago client's spending Gartner keeps twelve months later. Above 100% it means existing clients spend more each year; below 100% the installed base is shrinking in dollar terms before any new business. GTS wallet retention fell to 96% in 2025 from 102% in 2024, and GBS to 99% from 106% [28]. Both crossed below 100% for the first time in years. Management attributes the drop to "lower levels of spending by existing clients" [29].
Source: FY2025 Annual Report, Insights Segment business measurements [30]; prior years per FY2020–FY2024 Forms 10-K.
Client retention held up better — GTS at 85%, GBS at 86% — so Gartner is largely keeping its customers; it is keeping less of their spend [31]. Whether that reflects a temporary IT-budget squeeze or something more durable is the question the rest of this report tests. The company itself names artificial intelligence as a disruptive force that "could affect the nature of how we generate revenue" and expects "more competition with increased adoption of AI services" — a plausible structural pressure on a business that sells packaged expertise [32].
The stock
The market has already voted on the stall. Gartner's shares compounded from about $101 at the end of 2016 to a peak above $580 in early 2025 — more than a fivefold gain — then fell to $252 by the end of 2025 and to roughly $142 by mid-2026, about 75% below the peak.
Source: daily price history, year-end closes (2026 as of July); as reported.
That reset has taken the valuation from growth-stock territory to something much plainer. At about $142, the shares trade near ten times the roughly $13.70 of consensus 2026 earnings per share — against the 30-times-plus multiples the stock carried for most of the prior decade. Consensus now expects 2026 revenue to be flat-to-slightly-down, so the market is pricing little or no near-term growth. The gap between that price and the quality of the underlying cash machine is the tension this report exists to resolve.
The question this report works through
Gartner is a high-return, cash-generative research-subscription business whose value depends on the durability of Insights contract-value growth. The question this report works through is whether the current stall in that engine — contract value flat and wallet retention below 100% for the first time in years — is a cyclical pause in a franchise that still dominates its niche, or the leading edge of a structural decline, now that the market has repriced the shares to roughly ten times forward earnings. Every chapter that follows connects to that question: how durable the subscription moat really is, what the cash and capital-allocation record is worth, how AI cuts for and against the model, and what the current price implies.
The Moat
Gartner's competitive position holds two distinct kinds of protection, and they are moving in opposite directions. The first — clients renewing year after year — is intact: account retention has sat in a narrow 83–89% band for five straight years. The second — the ability to raise spend on those retained accounts — has weakened, with wallet retention sliding for four consecutive years and falling below 100% in 2025. Measured against its only pure peer, the moat is widening; the pressure is on the whole category, and Gartner is losing less of it.
What the moat protects
The asset is a proprietary-data flywheel, not a library. Gartner is in steady contact with over 13,000 distinct client enterprises, runs more than 510,000 direct client interactions a year, and employs more than 2,400 business and technology experts plus 920 consultants across 30-plus countries [1]. Those interactions are the raw material: what 80,000-plus executives are actually deciding feeds the research, and the research is what the next executive pays to read. Scale compounds the loop — more clients generate more signal, which makes the insight more valuable, which attracts more clients.
Total Contract Value
Client Enterprises
Experts + Consultants
Contract Value vs Forrester
Sources: FY2025 Annual Report, Item 1 Business [2] and Insights segment metrics [3]; Forrester contract value from its FY2025 10-K [4]. Multiple is Gartner CV $5,155M ÷ Forrester CV $292M.
Gartner is candid that none of this is a legal barrier. Its own 10-K states that "limited barriers to entry exist" in its markets, that it competes with free sources of information available through the internet, and that it anticipates more competition as AI services are adopted [5]. The defense is not a patent; it is switching cost and authority — the Magic Quadrant that vendors organize roadmaps around, and the analyst on the other end of an inquiry call. Those show up in the retention numbers, which is where the moat is measured.
Two retention numbers
Gartner reports two retention rates, and the gap between them is the diagnostic. Client retention counts logos — the share of enterprises that were clients a year ago and still are. Wallet retention counts dollars — the contract value retained from those clients, including whether they spent more or less [6]. When wallet retention runs above client retention, retained clients are spending more; when it falls below 100%, the surviving base is spending less in aggregate before any new business is added.
Source: FY2022 10-K (2021–22), FY2024 10-K (2023–24) and FY2025 10-K (2025) Insights/Research segment metrics [7] [8] [9].
The two lines tell different stories. Client retention (the grey lines) has barely moved — GTS between 83% and 86%, GBS between 86% and 89% — and in 2025 GTS retention actually ticked up, to 85% from 84% [10]. Enterprises are not leaving. Wallet retention (the purple lines) is a steady glide down: GTS from 106% in 2021 to 96% in 2025, GBS from 115% to 99%. The moat is doing its first job — holding the account — while its second job, compounding the spend inside that account, has faded. Management attributes the 2025 drop to "lower levels of spending by existing clients," with a double-digit decline in the US public sector [11].
One quieter figure sits alongside this: the count of distinct client enterprises has fallen from more than 15,000 in 2021 and 2022 to over 13,000 in 2025 [12] [13]. Interactions per year rose over the same span, to a record 510,000, so engagement deepened even as the logo base narrowed — the smaller accounts thinned out while the core relationships intensified.
The peer test
The sharpest test of whether this is Gartner's problem or the category's is Forrester Research — the one indexed peer that runs the same syndicated-research subscription model (research is roughly three-quarters of its revenue). Forrester's retention levels sit materially below Gartner's on every line.
Sources: Gartner FY2025 10-K — total revenue [14], contract value and retention [15], client enterprises [16]; Forrester FY2025 10-K — key metrics [17] and total revenue [18].
Forrester's contract value fell 6% to $292 million, its client count dropped 7% to 1,797, and its wallet retention was 87% against Gartner's 96% [19]. Its client retention of 77% — even after a four-point improvement — sits eight points below Gartner's. Two readings follow. The category-wide one: the whole syndicated-research model is under wallet-retention pressure, so Gartner's sub-100% reading is not idiosyncratic. The relative one: at roughly 17 times Forrester's contract value, with retention nearly ten points higher and contract value still growing where Forrester's is shrinking, Gartner is the clear winner inside its niche, and its lead is widening as the weaker competitor contracts. The moat, defined as relative position, is stronger than it looks in isolation — but it sits inside a category whose ceiling is being tested.
Cyclical or structural
The evidence genuinely cuts both ways, and separating the cyclical from the structural is the harder task.
The cyclical case is specific and recent. The single largest drag was the US federal government: management flagged a double-digit public-sector decline, and by Q1 2026 disclosed that federal contract value was only about $114 million of a $5.3 billion base, with the DOGE-driven cuts having hit from March 2025 and beginning to lap in the second quarter [20]. Strip out federal and Q1 2026 contract value grew 3.5%, not 1%, and GTS wallet retention was 99% rather than 97% [21]. Engagement — the leading indicator Gartner ties to renewal — rose across every month of the quarter, up more than 170 basis points year-on-year [22]. New business slowed in March on macro caution rather than collapsing. On this read, the stall is IT budgets tightening and one government retrenching, both of which pass.
The structural case is that the wallet-retention glide began well before DOGE. The line fell from 106% to 101% between 2021 and 2023 — three years before any federal cut — and the logo count started shrinking over the same period. Forrester's parallel decline points to category maturity rather than a Gartner-specific stumble, and Gartner's own filing concedes that LLMs providing substantive content "could reduce the need to enter our websites," while clients loading proprietary Gartner content into large language models "could reduce the value of our offerings" [23]. If packaged expertise is what a chatbot increasingly approximates, the erosion of pricing power is the leading edge, not a passing dip.
AI on both sides of the ledger
AI is simultaneously the clearest threat to the model and its most-requested subject. Gartner sits between the CIOs buying AI, the vendors selling it, and its own independent coverage of it, and management calls AI the most requested topic across every role it serves — the argument being that an authoritative, vendor-neutral guide is more valuable, not less, when executives face information overload [24]. It launched AskGartner, an AI tool over its research, in August 2025 [25].
The tell is that both syndicated-research players are now embedding AI to defend renewals. Forrester attributes its four-point client-retention improvement partly to the launch of its own AI Access product in the third quarter of 2025 [26]. That both are investing to defend renewals signals each treats AI as a genuine threat to the model. AI is plausibly accretive to Gartner's authority in the near term and corrosive to its pricing power over a longer one, and which force dominates is not yet visible in the numbers.
Reading the stall
The weight of the evidence favors the cyclical read today. The account-level moat — the harder thing to rebuild — is fully intact: client retention is stable to rising, engagement is climbing, and the dollar softness maps cleanly onto federal cuts and a macro pause that management is already lapping. Ex-federal, the engine is still growing mid-single digits. The strongest fact against that read is that wallet retention has fallen for four straight years, starting before the federal shock and alongside a shrinking logo count and an identical decline at Forrester — a pattern more consistent with a maturing, AI-pressured category than a clean cyclical trough.
Two thresholds would settle it. Wallet retention re-crossing 100% as the federal comparison eases would confirm the pricing-power leg was cyclically depressed, not structurally impaired. Client retention breaking below its five-year floor of roughly 83% would mean the durable part of the moat — accounts, not just dollars — had started to give, which is the outcome the bull case cannot absorb. Client retention, more than the wallet number, is the line that would signal structural damage.
Across 2021-2025 Gartner repurchased about $6.0 billion of stock (~103% of cumulative free cash flow) at a blended average near $280 a share, funding 2025's record $2.0 billion program partly with $800 million of new ~5.3% senior notes, into a stock that fell to about $142 by mid-2026; yet executive pay is tied to Contract Value, EBITDA and revenue rather than earnings per share, and the CEO's 2025 compensation actually paid was negative $7.0 million against a $19.2 million grant-date total, so the buyback ran ahead of the market price without being an EPS-target mechanism — and it was executed while GTS contract value was flat at $3,910 million and total contract value only 1% higher.[1][2][3]
A buyback that shrinks the share count is often the arithmetic a management team runs to hit an earnings-per-share target. This one is not that. Earnings per share appears nowhere in Gartner's pay plan: the annual bonus is set on revenue and EBITDA, the long-term equity award on Contract Value, and the executives directing the repurchases are measured on those operating metrics, not the per-share figure a buyback lifts [4][5]. In 2025 the CEO's realized pay went below zero as the shares fell — his stock awards were marked down by more than his whole year's grant [6]. What the repurchase is, then, is a bet: that the cash flows being retired are worth more than the market's mid-2026 price for them.
The bet is, so far, underwater. The 21.5 million shares retired over five years cost about $6.0 billion and are worth roughly $3.1 billion at $142 — a paper shortfall near $3 billion. Only the ~$535 million repurchased in the first quarter of 2026, near $142, sits below the ~$187 a share the reverse-DCF treats as the no-growth floor (Valuation Reset); 2025's ~$284 average sits above it. Whether the repurchasing compounded or destroyed per-share value is not settled by the record — it turns on the durability question the report is built around. If contract value re-accelerates, retiring a fifth of the shares below their eventual worth reads as conviction; if it fades, it reads as borrowing to buy a shrinking stream.
A cash machine, by design
The subscription model that drives the Insights franchise also makes Gartner unusually cash-generative. Clients pay in advance, the business owns few hard assets, and capital spending has held near $100–115 million a year — under 2% of revenue [7]. The result is free cash flow (operating cash flow less capital expenditure) that has exceeded net income in every one of the last five years, and by a wide margin in years without one-off items.
FY2025 free cash flow ($M)
FCF / net income, FY2025
Capex as % of revenue
Source: FY2025 Annual Report (Form 10-K), Consolidated Statements of Cash Flows and Operations [8]; figures computed (FCF = operating cash flow − capex).
Source: FY2025 and FY2022 Annual Reports (Form 10-K), Consolidated Statements of Cash Flows [9][10]; FCF computed as operating cash flow − capex.
The two years where conversion tops 150% — 2021 and 2025 — are the paid-in-advance model working in Gartner's favour and against reported earnings: deferred revenue and working-capital swings lift cash above profit, and in 2025 a $150 million non-cash goodwill charge (discussed below) depressed net income without touching cash [11]. The cash generation is real and consistent; the quality of the engine is not in question here. How that cash is deployed is what the rest of this chapter examines.
One lever: buybacks
Gartner pays no dividend and has made almost no acquisitions in recent years — 2024 and 2023 acquisition spend was $2 million and $4 million [12]. Practically all discretionary cash goes to repurchases. Across 2021–2025 the company bought back about $6.0 billion of stock against roughly $5.9 billion of cumulative free cash flow — it returned, in effect, every dollar the business produced, and in three of five years spent more than it earned in cash.
Source: FY2025 and FY2022 Annual Reports (Form 10-K), Consolidated Statements of Cash Flows (purchases of treasury stock) [13][14]; FCF computed.
The mechanical effect has been exactly what buybacks are meant to do: concentrate ownership. Diluted shares fell from 92.1 million in 2018 to 75.6 million in 2025, and to 70.0 million by the first quarter of 2026 — a fifth of the company retired in eight years [15][16].
Source: FY2025 Annual Report (Form 10-K) [17] and Q1 FY2026 Form 10-Q [18]; pre-2021 figures from prior filings, historical series.
The price paid
A buyback creates value only when the shares are bought below what they turn out to be worth. On that test the record is, so far, unflattering. The approximate average price Gartner paid rose every year from 2021 to 2024 as the stock climbed, peaking near $460 a share in 2024, then eased to about $285 in 2025 as the price fell. Blended across the five years, roughly $6.0 billion bought about 21.5 million shares at an average near $280 — against a share price of about $142 in early July 2026.
Sources: shares repurchased from each year's Form 10-K MD&A [19][20][21][22][23]; cash outlay from the cash-flow statements [24]; average price computed.
Two things keep this from being a simple indictment. First, buybacks are not marked to market like a trading position — the shares are retired for good, and the payoff depends on Gartner's cash flows over years, not on the July 2026 quote. Second, the timing within 2025 was better than the headline suggests: the stock opened the year near $540, and the $2.0 billion spent that year at an average near $285 means the bulk of it was deployed in the second half, when the price sat in the $220–290 range, not at the January high [25]. Management leaned into the decline rather than buying the top. The company kept going in early 2026, repurchasing a further $535 million in the first quarter [26].
Every level so far has proven to be above the next one. At today's price the 21.5 million shares bought over five years are worth roughly $3.1 billion, against about $6.0 billion paid. Whether that was value created or destroyed is not yet decided — it turns on the same durability question the report is built around. If the contract-value stall is cyclical, retiring a fifth of the shares at an average well below their eventual worth will read as conviction; if it is structural, it will read as feeding cash into a falling business.
Debt now helps fund the buyback
For most of the last decade Gartner's repurchases were funded from cash flow. That changed at the margin in 2025. To sustain a $2.0 billion program while free cash flow was $1.2 billion, the company drew down cash and, in November 2025, issued $800 million of new senior notes — $350 million at 4.95% due 2031 and $450 million at 5.60% due 2035 [27]. That new money costs roughly 5.3%, against a blended ~4.0% on the older 2028–2030 notes — Gartner is now borrowing at a higher rate, in part, to buy its own shares [28].
The leverage this adds is still modest. Gross debt rose to about $3.0 billion, but against $1.7 billion of cash and roughly $1.4 billion of adjusted EBITDA, net debt is around $1.3 billion — under one turn of EBITDA — and interest is covered close to nine times by operating income [29][30]. The balance sheet is not stretched. What has changed is the posture: management is confident enough in the cash engine to lever up and repurchase into a 70%-plus drawdown, with $0.7 billion of authorization remaining at year-end and a further $500 million added in January 2026 [31].
Net debt, end-2025 ($M)
Net debt / adj. EBITDA
Source: FY2025 Annual Report (Form 10-K), Note 6 Debt and Statements of Operations [32][33]; adjusted EBITDA and net debt computed.
The one deal outside the core
The buyback discipline stands in contrast to Gartner's one visible operating bet outside the core. The Digital Markets business — the software-listings operation reported in the "Other" segment — was written down by $150 million in the third quarter of 2025, after "ongoing weakness in the market" forced a cut to its long-term earnings forecast [34]. In February 2026 the company sold it outright for about $105 million net of cash, booking a small $6 million gain over its impaired carrying value [35]. The episode is small relative to the $6 billion of buybacks, and exiting a non-core, decelerating asset is reasonable housekeeping — but it is a reminder that Gartner's returns come from the research franchise, not from capital deployed elsewhere, and that the impairment (not any cash loss) is what pulled 2025 reported earnings down.
The read
Gartner is an unusually cash-generative business that has chosen to return essentially all of that cash through buybacks, and the mechanical result — a fifth of the shares retired, EPS supported even as net income wobbles — is real. The price paid is what the record cannot yet settle. The average paid over five years is roughly double the current quote, the largest program yet was executed while the core engine stalled, and 2025 marked the first time debt was raised to help fund it. Set against that: leverage remains under a turn of net EBITDA, the 2025–26 buying was concentrated at derated prices rather than the peak, and the shares are permanently gone. Whether this compounded or eroded per-share value cannot be judged from the buyback record alone — it depends on whether the cash flows being bought prove durable. The signal to watch is straightforward: a re-acceleration in contract value would validate the aggressive repurchasing; continued erosion would leave management having borrowed to buy a shrinking stream.
Margins and EPS
Gartner's headline profit numbers look worse than the business. GAAP operating margin fell from 20.9% in 2023 to 15.8% in 2025, but 2023 was flattered by a $135.4 million divestiture gain and 2025 carried a $150 million non-cash goodwill charge; strip both and operating margin drifted only from about 18.6% to 18.1%. The metric management guides on — adjusted EBITDA — grew every year, with margin steady near 25%. What has actually stopped growing is per-share earnings, and management's answer for restarting it leans partly on buybacks.
Adjusted EBITDA FY2025 ($M)
Adjusted EBITDA Margin
Adjusted EPS FY2025
Sources: Q4/FY2025 earnings release (Form 8-K), Adjusted EBITDA and Adjusted EPS reconciliations [1][2].
The headline overstates the damage
The reported operating-margin slide is real arithmetic, but two one-off items sit inside it. In February 2023 Gartner sold TalentNeuron, a non-core unit, and booked a $135.4 million pre-tax gain that ran through operating income [3]. In the third quarter of 2025 it wrote down its Digital Markets business by $150 million, a non-cash goodwill impairment that also lands in operating expenses [4]. Neither reflects the recurring economics of selling research subscriptions.
Source: derived from FY2023 and FY2025 Annual Reports (Form 10-K), Consolidated Statements of Operations; reported margin adjusted for the $135.4M 2023 TalentNeuron gain and the $150M 2025 goodwill impairment [5][6].
On a clean basis, operating margin fell roughly 55 basis points over two years, not the 515 basis points the headline shows. That is a business under pressure, not a business unravelling. The distinction matters because the reset in the shares was partly a reaction to reported earnings — diluted EPS fell 40% in 2025 to $9.65, from $16.00 — that overstate the deterioration in the underlying operation (Capital Allocation walks through the same distortion in net income).
The cleaner gauge: adjusted EBITDA
Gartner runs to an adjusted-EBITDA target, and on that measure the profit engine is still moving forward. Adjusted EBITDA rose from $1,483 million in 2023 to $1,556 million in 2024 and $1,611 million in 2025 — up 4% last year even as revenue grew 4% and contract value was roughly flat [7]. Margin, however, has compressed from the pandemic-era peak.
Sources: Q4/FY2023, Q4/FY2024 and Q4/FY2025 earnings releases (Form 8-K), Adjusted EBITDA reconciliations; margin is Adjusted EBITDA over reported revenue [8][9][10].
Margin fell from about 26.9% in 2022 to roughly 24.8% in 2024 and held there in 2025. Part of that step-down is a normalization: in 2020 and 2021 the destination-conference business was largely shut by the pandemic, so its costs — venues, travel, staging — came out of the base while high-margin subscription revenue kept flowing, inflating margin. As events returned, conferences revenue rebuilt to $645 million in 2025 from $505 million in 2023 [11]. Because conferences convert at roughly half the contribution margin of the subscription business, their return is mildly dilutive to the blended figure even as it adds profit dollars.
The important point is what the margin move is not. It is not deteriorating unit economics. The subscription business — Insights, about four-fifths of revenue — carried a 77% contribution margin in 2025, up 14 basis points on the year, and the company-wide contribution margin actually rose 85 basis points in the fourth quarter [12]. The product still earns what it always did. The compression sits below the segment line, in the selling and administrative cost the company chose to carry.
Where the margin went: the sales-force build
Gartner grows contract value by adding quota-bearing salespeople who ramp over roughly two years. When demand slows after the heads are hired, cost runs ahead of revenue — which is what happened. Combined quota-bearing headcount jumped about 19% in 2022, to nearly 4,800, then kept climbing through 2024 even as contract-value growth decelerated. Only in 2025 did the company reverse, cutting heads about 2% [13].
Sources: FY2022, FY2023 and FY2025 Annual Reports (Form 10-K), MD&A; combined Global Technology Sales and Global Business Sales quota-bearing associates at each year-end [14][15][16].
The cost of that build shows up in one line: selling, general and administrative expense rose to 47% of revenue in 2025 from 46% in 2024 and 45% in 2022 [17]. A roughly two-point move on $6.5 billion of revenue is about $130 million of operating profit — close to the entire clean operating-income decline. The sales force is the swing factor.
The 2025 reversal is deliberate. Management describes a "business and technology insights" transformation begun in the second half of 2025 — Chief Executive Gene Hall called the changes more significant "than we've ever done" in his 20 years — reorienting the company around client engagement and shedding staff whose skills did not fit, alongside the decision to exit Digital Markets [18]. The stated aim is to be able to reach "double-digit growth, even in a really bad environment." Whether that restores operating leverage or simply defends the current margin depends on the same question the report turns on: whether contract-value growth re-accelerates.
The algorithm, and what carries it near-term
Management's long-run commitment is compound adjusted-EPS growth "at or above 12%," reaffirmed in May 2026 off a 2025 base [19]. Recent per-share earnings have not been on that path, and the reported figures are noisy.
Sources: Q4/FY2023, Q4/FY2024 and Q4/FY2025 earnings releases (Form 8-K), Adjusted EPS reconciliations [20][21][22].
The apparent 24% jump in 2024 and the 7% fall in 2025 are largely tax. Adjusted EPS uses the actual tax rate, and 2024's was unusually low — a 9.6% effective rate helped by a $161.9 million intellectual-property-transfer benefit — while 2025's normalized to 24.7% [23]. Beneath the tax noise, adjusted EPS grew from $11.33 in 2023 to $13.17 in 2025, about 8% a year, and a meaningful slice of that came from a lower share count rather than more profit — diluted shares fell from 79.7 million in 2023 [24] to 75.6 million in 2025, and to 72.1 million by the fourth quarter of 2025 [25].
Asked directly how the 12% target is reached when revenue is not growing near that rate, the Chief Financial Officer named three levers — contract-value re-acceleration, margin expansion "over time," and buybacks — and placed buybacks among them plainly: "we have significant capital to deploy for buybacks… our intention is to continue share repurchases, which is one of the bigger drivers of that EPS CAGR" [26]. The buyback record, and the roughly $2.4–2.5 billion repurchased over the prior twelve months, is the subject of Capital Allocation.
With contract value roughly flat, two of the three EPS levers — revenue re-acceleration and margin expansion — are promises rather than results. In the near term the algorithm is carried by the third, share-count reduction, and by cost discipline.
The read here: the profitability of Gartner's actual business has held up far better than the reported margin or GAAP EPS suggest — adjusted EBITDA is at a record and unit contribution margins are rising. But the per-share growth machine has downshifted, and for now it runs on buybacks and cost cuts more than on operating momentum. The strongest fact against that reading is management's own operating model, which holds quota-bearing headcount growth to about 300 basis points below expected contract-value growth [27] — a design that should let margins expand as soon as contract value turns up, restoring the operating legs of the algorithm. For 2026, management rebaselined the adjusted-EBITDA margin to 24.1% and expects expansion "from there" over the medium term [28]. The signal that would change the read is a contract-value re-acceleration that lets sales productivity — revenue per quota head — climb, and with it the margin; its absence would leave a business defending 25% margins with buybacks against a share count that cannot keep falling.
Gartner pays its executives to grow the operating metrics this report turns on — Contract Value, revenue and EBITDA — not the per-share figures that buybacks flatter. Nearly all of the CEO's target pay is incentive-based, and in 2025's share-price collapse his realized pay went negative. The alignment is genuine. The two blemishes: the year's bonus and equity targets carved out the federal drag, and one person holds both the chair and the CEO title.
What management is paid to grow
The natural worry about a company promising a double-digit earnings-per-share compound rate while borrowing to buy back stock (Capital Allocation, Margins and EPS) is that management is being paid on earnings per share, the metric a shrinking share count mechanically inflates. Gartner's pay design says otherwise. Across 2021-2025 Gartner repurchased about $6.0 billion of stock (~103% of cumulative free cash flow) at a blended average near $280 a share, funding 2025's record $2.0 billion program partly with $800 million of new ~5.3% senior notes, into a stock that fell to about $142 by mid-2026; yet executive pay is tied to Contract Value, EBITDA and revenue rather than earnings per share, and the CEO's 2025 compensation actually paid was negative $7.0 million against a $19.2 million grant-date total, so the buyback ran ahead of the market price without being an EPS-target mechanism — and it was executed while GTS contract value was flat at $3,910 million and total contract value only 1% higher. The annual cash bonus for every named executive, including CEO Eugene Hall, rests solely on two company-wide financial objectives — EBITDA and revenue, each weighted 50% [1]. The long-term equity award is 70% performance share units tied to Contract Value and 30% stock appreciation rights [2]. Earnings per share appears nowhere in the plan.
That matters because Contract Value is the same leading indicator the whole investment case is built on. The proxy calls CV "our single most important performance metric," the one that "translates to Insights revenue growth" and drives long-term profit [3]. In the SEC pay-versus-performance disclosure the company names CV as "the most important metric in linking compensation actually paid to our NEOs to Company performance," at 70% of the CEO's long-term award [4]. The pay plan and the durability question in the through-line are pointed at the same variable.
The stakes are large because pay is heavily variable. Of the CEO's 2025 target compensation, 95% is incentive-based and 88% takes the form of equity awards; for the other executives the equity share is 74% [5]. Salary is a rounding error on a $19.2 million package; the rest is contingent on CV, revenue and EBITDA, and on the stock.
Source: 2026 Proxy Statement (DEF 14A), Compensation Discussion & Analysis [6][7].
2025: the plan paid, but the growth metrics missed
The design looks aligned; the 2025 outcome is where the nuance sits. The annual bonus paid out at 119.6% of target and 82.1% of the CEO's performance shares were earned — above-target results in a year the stock fell roughly three-quarters from its peak [8][9]. Two facts temper how generous that looks.
First, the payout was carried by cost control, not growth. EBITDA came in at $1,537 million against a $1,463 million target — a 149.3% payout. But revenue landed at $6,274 million, below its $6,315 million target, for 89.8% [10]. And Contract Value reached $5,047 million versus a $5,186 million target, so only 82.1% of the performance shares vested [11]. Both growth metrics missed; the one that beat was profitability. That is consistent with what the operating chapters found — margins defended through the stall while the top line stalled.
Source: 2026 Proxy Statement (DEF 14A); all figures exclude the U.S. federal public sector Insights business and are measured FX-neutral [12][13].
Second, the goalposts excluded the year's biggest problem. The Compensation Committee set both the bonus and the CV targets to exclude the U.S. federal public sector Insights business — the roughly 5% of Contract Value hit by the government-efficiency cuts documented in the Inflection Test — citing the "unusual amount of volatility and uncertainty" around that business [14]. There is a defensible rationale: setting a target around an unforecastable federal shock could have been arbitrarily high or low. But the effect is real — executives were measured against a book that carved out the single largest drag on the reported number, and even so the growth metrics came in below target. Say-on-pay support, while still passing comfortably, eased to 93% of votes cast in 2025 [15].
The pay that actually showed up
Grant-date pay tables overstate what management kept. Because most of the package is equity, the SEC's "compensation actually paid" measure — which marks unvested awards to the year-end stock price — tells a sharper story. In 2025 the CEO's compensation actually paid was negative $7.0 million, against a $19.2 million figure in the summary table. His outstanding, unvested stock appreciation rights and performance units were written down with the share price by more than his entire year's grant [16].
Source: 2026 Proxy Statement (DEF 14A), Pay Versus Performance table; a fixed $100 invested at end-2020 was worth $158 at end-2025, down from $302 a year earlier [17].
The swing runs both ways, which is the point. In 2021, when the stock roughly doubled, the same measure showed $80 million of compensation actually paid on a $14 million grant. The stock appreciation rights — 30% of the equity award — "only have value to the extent the price of our Common Stock exceeds the grant price," so the awards granted at 2024–2025 prices well above today's $142 are worth little now [18]. Management's realized wealth tracks the shareholder's, up and down, with leverage. Whatever else the pay plan does, it did not insulate insiders from the drawdown.
Ownership and the guardrails
The alignment extends to what management holds outright. Hall owns about 1.22 million shares, 1.8% of the company — worth on the order of $170 million at the current price, and a multiple of any single year's pay [19]. The CEO is required to hold stock worth at least six times salary (three times for other executives), and all were in compliance at year-end [20]. Executives and directors are barred from hedging or pledging company stock, so those stakes cannot be quietly neutralized, and a Dodd-Frank clawback applies to incentive pay in the event of a restatement [21][22]. The pay ratio — CEO to median employee — is 151 to 1, high in absolute terms but unremarkable for a company whose CEO comp is 88% equity [23].
The clearest governance weakness is board leadership structure. Hall holds both the chair and CEO roles, the sole non-independent director on a 13-person board [24]. The usual mitigants are in place — 12 of 13 directors independent, fully independent Audit, Compensation and Governance committees, and a lead independent director (Karen Dykstra) with defined responsibilities [25]. A combined chair and CEO is a governance debit rather than a red flag, and it is a recent one: Hall added the chairmanship in 2024 after two decades as CEO. Succession is the latent question a long-tenured founder-operator structure leaves open, but nothing in the current record points to stewardship that works against outside holders.
The read
On the evidence, management's incentives are aligned with the operating metrics the case turns on. Executives are paid to grow Contract Value, revenue and EBITDA, and they hold enough stock, on terms that cannot be hedged away, that the 2025 collapse cut their realized pay to below zero. That is a meaningful answer to the skeptic who suspects the aggressive repurchasing is financial engineering dressed up as capital return: the people directing it are not paid on earnings per share, and they lost money alongside shareholders. The strongest fact against a clean read is the 2025 target-setting, which excluded the federal drag and still produced above-target bonuses off a beat on cost rather than growth — a committee leaning toward generosity in a hard year. What would change the read in either direction is visible in the next two proxies: whether the excluded-federal carve-out becomes a habit once the DOGE headwind laps, and whether CV — the metric management is genuinely paid on — resumes the growth the equity plan keeps setting targets against.
Valuation Reset
At about $142 in mid-2026, Gartner trades near 10 times forward earnings and 8 to 9 times free cash flow — a quarter of its February 2025 peak multiple. On a plain discounted-cash-flow read, that price implies free cash flow shrinks two to three percent a year in perpetuity; merely holding free cash flow flat would be worth closer to $170–210 a share. The gap between that price and a flat-cash-flow value is what the arithmetic assigns to a permanent contract-value stall.
The prior chapters established the pieces this one prices: a subscription engine throwing off more than $1.1 billion of free cash a year (Capital Allocation) on contract value that stopped growing (The Moat), with clean operating margins near 18% once one-offs are stripped (Margins and EPS). The question here is narrower — what the current price assumes, and where the arithmetic leaves the margin of safety.
The reset in one number
Share Price (Jul 7, 2026)
From Feb-2025 Peak
Forward P/E (FY2026)
Free Cash Flow Yield
Source: market prices as of July 7, 2026 and consensus estimates, as reported; free cash flow yield derived on FY2025 free cash flow of $1,175.2 million [1].
The stock reached an intraday high of $584 on February 4, 2025 and closed at $141.61 on July 7, 2026, a decline of about 76%. Because Gartner has retired roughly a fifth of its shares over eight years, the drop in market value is slightly smaller than the drop in price, but the derating is the dominant force. At the peak, the market capitalised the company near 41 times forward earnings and 29 times adjusted EBITDA; today those multiples are roughly 10 times and 7 times.
Source: derived from market prices (Feb 4, 2025 peak; Jul 7, 2026 close) and reported adjusted EBITDA [2] and adjusted earnings per share [3].
The share-price path shows the round trip. The stock roughly tripled through 2023–2024, peaked in early 2025, then gave back everything and more as contract value flattened and US federal spending was cut.
Source: market prices (year-end closing prices; final point July 7, 2026 close), as reported.
What the price buys
The multiples all say the same thing from different angles: a cash-generative franchise priced for little or no growth. The forward earnings multiple is about 10 times this year's consensus and 9 times next year's. On cash — the cleaner lens for an asset-light compounder whose reported earnings swing on non-cash items — the market pays about 8.4 times trailing free cash flow, an 11.9% free-cash-flow yield.
Source: derived from market prices (Jul 7, 2026), consensus estimates, and reported results — revenue and GAAP EPS [4]; adjusted EPS [5]; adjusted EBITDA [6]; free cash flow [7]; net debt [8].
The enterprise-value figures rest on a modest balance sheet: $2,976 million of gross debt against $1,723 million of cash at end-2025 leaves net debt near $1.3 billion, about 0.8 times adjusted EBITDA [9]. Enterprise value is roughly $11.2 billion on a market capitalisation of about $9.9 billion (70.0 million shares). Leverage adds little to the equity risk here; the valuation debate is about the cash stream, not the capital structure. One caution on the cash number itself: FY2025 free cash flow of $1,175 million came on operating cash flow of $1,290 million and capital spending of only $115 million [10], but that year's cash conversion was flattered by a non-cash goodwill charge and working-capital timing (Capital Allocation). A normalised base nearer $1.1–1.2 billion is the more defensible input, and the read below uses $1,175 million while flagging that base as the main sensitivity.
What the price implies
The same calculation runs in reverse. Discounting free cash flow of $1,175 million at a cost of equity and solving for the perpetual growth rate that reproduces the $142 price isolates what the market has assumed. At a 9% discount rate — reasonable for a stable, low-leverage, asset-light business — the price is consistent with free cash flow declining about 2.6% a year forever. Across an 8% to 10% discount range, the implied growth sits between roughly minus 3.4% and minus 1.7%.
Source: derived — single-stage Gordon growth model on FY2025 free cash flow of $1,175 million [11] and 70.0 million shares.
The right-hand column is the more useful frame. If Gartner never grows free cash flow again — holds it flat in nominal terms — a 9% discount rate values the equity near $187 a share, with a range of about $168 to $210 as the discount rate moves. The stock trades roughly a quarter below the low end of a no-growth valuation. To justify $142, an investor has to assume not stagnation but modest permanent shrinkage of the cash stream.
That is the core of the reset. The market is not pricing Gartner as a slowing compounder but as a business in gentle secular decline. Whether that is too harsh depends on the durability question the report has been working through: if the contract-value stall is cyclical and the base holds or resumes low-single-digit growth, the no-growth valuation is a floor and the price is a discount to it; if the stall is structural and the retained-client dollar base keeps eroding, the $1,175 million base itself shrinks and the "cheap" 8-times-cash multiple is measured against a falling number.
Against consensus
The sell side sits above the price but is not enthusiastic. The mean twelve-month target is $165 (median $164), about 16% above the current quote, with a wide $120 to $203 range that captures exactly the cyclical-versus-structural disagreement. The rating distribution is telling: of fifteen analysts, nine rate the stock hold, four buy, and two sell — a neutral posture even with targets above the price.
Mean Target ($)
Low Target ($)
High Target ($)
Source: consensus analyst price targets (15 analysts), as reported July 7, 2026.
Consensus earnings tell the same divided story. FY2026 EPS is expected up about 4% and FY2027 about 12%, while revenue is seen down roughly 1% in 2026 and up about 4% in 2027. The gap between flat revenue and double-digit forward EPS growth is the buyback and margin algorithm at work — management's own decomposition names repurchases as one of the bigger near-term EPS drivers (Margins and EPS). At $142, share repurchases retire stock at about 12 times cash and roughly 10 times earnings, so continued buybacks are accretive on the arithmetic; the constraint is that the buyback lever depends on the same cash base the durability question governs.
The read
On the evidence, the reset has moved the price below a no-growth valuation of the cash stream, so at $142 the market already discounts a mildly structural outcome rather than a cyclical pause. That is a genuine improvement in the risk-reward from the peak, where a 41-times multiple required years of mid-teens growth to be uneventful.
The strongest fact against that read is the one this chapter cannot resolve from valuation alone: the $1,175 million free-cash-flow base is only as good as contract value, and contract value was flat with wallet retention below 100% [12]. A cheap multiple measured against an eroding base is not a margin of safety. The discount rate and the durability of that base are the two assumptions the fair-value range is most sensitive to; of the two, the base matters more, because it is the one the business — not the market — controls.
What would change the read is checkable and near-term: contract value and wallet retention re-crossing into growth would convert the DCF from a declining perpetuity into a growing one and reset fair value well above today's price, while a second year of sub-100% wallet retention and a falling cash base would validate the market's structural pricing and make the current multiple appropriate rather than cheap. The valuation does not settle that question; it prices it, and prices it cautiously.
Reading the newest quarters
Total contract-value growth was flat-to-1% from end-2025 into the first quarter of 2026, but excluding a US federal book that was a roughly 250-basis-point drag the base grew 3.5% and GTS wallet retention ticked up to 97% (99% ex-federal) for its first improvement in over a year, while the most discretionary segment, Conferences, grew 9% currency-neutral to $644.7 million on a 15% rise in vendor exhibitor revenue, so vendor willingness to pay to reach Gartner's audience rose even as retained-client subscription spend fell. [1] [2] [3] [4] [5]
That sentence carries two things at once. The reported pickup over the coming quarters is partly mechanical: as the 2025 federal non-renewals roll off the trailing four-quarter comparison, the drag eases whether or not the rest of the book improves, so the figure that matters is the ex-federal 3.5%, not the 1% headline [6]. Cutting the other way is the most deferrable work Gartner sells. In Consulting, recurring labor-based revenue fell 5% in 2025, consultant utilization slipped to 61% from 65%, and backlog fell 7% [7], and first-quarter 2026 Consulting revenue then fell a further 15% year-on-year [8], evidence that the caution reaches past the federal book and the subscription base into broader project-level spend.
The stakes ride on how that ex-federal figure carries. Contract value of about $5.3 billion governs the Insights subscription line that produces most of Gartner's revenue, and behind it the free-cash-flow base of about $1.2 billion the equity is priced against. If ex-federal growth holds near 3.5% or steps higher as the federal comparison laps, that cash-flow base holds and the no-growth value of about $187 a share (Valuation Reset) reads as a floor; if the base itself fades toward flat, the stream the valuation capitalizes shrinks, and the same multiple then sits on a smaller number. The case is most sensitive to the ex-federal base, and the 3.5%-versus-1% gap is the width of that sensitivity.
The five-quarter glide
Contract value (CV) is the annualized value of all subscription contracts in force — the forward book that becomes Insights revenue over the following year. Because it is a rolling measure, it moves slowly, and its deceleration through 2025 was orderly rather than a cliff. Total CV growth stepped down almost linearly, quarter after quarter, from 8.0% to 1.0%.
Sources: quarterly earnings releases (Form 8-K), Contract Value Highlights — Q4 FY2024 [9]; Q1 FY2025 [10]; Q2 FY2025 [11]; Q3 FY2025 [12]; Q4 FY2025 [13]; Q1 FY2026 [14].
The chart also shows where the damage sits. Global Business Sales (GBS) — the smaller, faster-growing book serving finance, HR, supply-chain and legal leaders — decelerated from 12% to 3% but flattened there and edged up to 3.2% in the first quarter [15]. Global Technology Sales (GTS) — three-quarters of the book — fell all the way to flat by the fourth quarter of 2025 and posted just 0.4% in the first quarter of 2026 [16]. GTS is where the stall is concentrated, and — as the next section shows — where the US federal government hit lands.
Anatomy of the "acceleration"
Management called it an inflection: on the first-quarter call, the CEO said "year-over-year contract value growth accelerated in the first quarter" and "we expect contract value will accelerate" through the year [17]. The headline supports that only marginally — 1.0% in the first quarter against a rounded 1% in the fourth. The cleaner signal is underneath it. Excluding the US federal government, first-quarter CV grew 3.5% [18].
Total Contract Value
Total CV Growth (FX-neutral)
CV Growth ex-US Federal
US Federal CV
Sources: Q1 FY2026 earnings release (Form 8-K), Contract Value Highlights [19]; Q1 FY2026 earnings call, CFO remarks [20].
The gap between 1.0% and 3.5% is almost entirely one line item. Gartner's Insights contract value with the US federal government was about $126 million at the end of 2025, and less than half of the prior year's federal book was retained during 2025 as the government cut discretionary spending [21]. By March 2026 the federal book was down to roughly $114 million [22], and management sized it as a 250-basis-point drag on first-quarter CV growth — the dominant headwind — adding that it now views the business as rebaselined and expects it "to be flat in 2026 and grow from there" [23].
That reframes the "acceleration." A large part of the reported improvement over the next several quarters is mechanical: as the federal non-renewals of 2025 roll off the trailing four-quarter comparison, the drag fades whether or not the rest of the book does anything. The case is most sensitive to the ex-federal base, currently growing 3.5% against the 1% headline, and whether it steps higher from there. On that, the first quarter offers early signs, not proof.
Two engines: renewals and new business
Contract-value growth has two sources: how much existing clients renew and expand (captured by wallet retention) and how much new business the sales force writes. Reading them separately is what distinguishes a bottom from a bounce.
Wallet retention — the share of the prior year's dollars kept before new sales — is where the first genuine turn shows up. GTS wallet retention fell for four straight quarters to a trough of 96% at the end of 2025, then ticked up to 97% in the first quarter of 2026, and stood at 99% excluding the federal book [24]. GBS wallet retention, by contrast, is still gliding down — from 106% to 98% — and has not yet inflected [25].
Sources: FY2024 Annual Report (Form 10-K), segment measurements [26]; FY2025 Annual Report (Form 10-K), segment measurements [27]; quarterly earnings-call transcripts, CFO remarks — Q1 FY2025 [28], Q2 FY2025 [29], Q3 FY2025 [30], Q4 FY2025 [31], Q1 FY2026 [32].
New business — the second engine, and the true forward driver — has not turned positive. GTS new business fell every quarter through 2025, bottoming at a 12% year-on-year decline in the third quarter (about 4% excluding federal), and was still down 4% in the first quarter of 2026, or 3% ex-federal [33] [34]. The declines are narrowing off the trough, but the sign has not flipped, and management noted that new business — strong through February — softened in March "due to the geopolitical environment" [35].
The leading indicator management points to ahead of both is engagement. Overall client engagement rose more than 170 basis points year-on-year in the first quarter (digital up more than 160, human interactions up more than 80), which the company links causally to retention: clients who engage more renew at higher rates [36]. Asked what drives the promised acceleration, the CEO named rising engagement flowing to higher retention and, in turn, more new business to existing clients [37]. That is a plausible chain, and engagement is genuinely up; but it is a leading indicator of a lagging one, and the read-through to CV has yet to appear in new business.
Productivity: the over-hire working off
One cost-side indicator moved in Gartner's favor. The sales force was cut for the first time in years: combined quota-bearing associates fell 2% to 4,984 at the end of 2025 [38], after a 19% hiring surge in 2022 [39] carried the headcount to a peak of 5,102 in 2024 [40]. With the book flat and heads down, contract value per quota-bearing associate rose about 3% in 2025 — the first sign that the 2022 over-hire into slowing demand is being absorbed.
Source: total contract value divided by combined quota-bearing sales associates. Heads per FY2022 [41], FY2024 [42], FY2025 [43]; contract value per FY2023 [44] and FY2025 [45] 10-Ks.
Contract value per quota-bearing associate was about $0.94 million in 2022 as the freshly hired class ramped, recovered to roughly $1.00 million in 2023–2024, and rose about 3% to $1.03 million in 2025 as heads were cut into a flat book. The recovery cuts two ways. It supports the case that margins can re-expand as the sales base is right-sized (the profitability side of this question is developed in Margins and EPS), and management has said it is now adding business developers ahead of account managers to seed 2027–2028 growth [46]. But it also confirms that the boom years were carried by headcount, not by rising output per seller — so a durable re-acceleration ultimately requires new business to grow, not just the salesforce to shrink.
What the 2026 guidance encodes
Whatever the CV base does this year, it reaches revenue with a lag, because subscription dollars are recognized over the year that follows. So the 2026 income statement is largely already set, and the guidance reflects that. Management updated the full-year outlook to consolidated revenue of at least $6.405 billion — about 1% FX-neutral growth — with adjusted EBITDA of at least $1.545 billion at a 24.1% margin, adjusted EPS of at least $13.25, and free cash flow of at least $1.16 billion [47].
2026 Revenue Guide
2026 Adj. EBITDA Guide
2026 Adj. EPS Guide
2026 FCF Guide
Source: Q1 FY2026 earnings call, CFO full-year guidance [48].
Two features stand out. First, the revenue line is essentially flat; the CV stall has already flowed through, and no amount of second-half CV acceleration changes 2026 revenue materially. Second, the earnings algorithm leans on the share count. First-quarter results were ahead of plan — revenue of $1.5 billion, adjusted EPS of $3.32 up 11%, and free cash flow of $371 million up 29% — but the EPS growth ran well ahead of the roughly flat operating base, carried by a 4% reduction in shares from $535 million of first-quarter buybacks [49]. The reliance on repurchases to bridge flat operations to the reaffirmed above-12% EPS algorithm is examined in Capital Allocation and Margins and EPS; the point for this chapter is that the 2026 print will look fine on EPS regardless of whether CV genuinely re-accelerates.
The read, and what would settle it
The first quarter of 2026 is consistent with a cyclical bottoming, not yet with re-acceleration. On the supporting side: total CV stopped falling, GTS wallet retention turned up for the first time in over a year, engagement is rising, the dominant federal drag has been identified and is lapping, and the ex-federal book is growing 3.5%. On the other side, and the strongest fact against reading this as a turn: the wallet-retention improvement is a single point and confined to GTS, GBS retention is still sliding, new business remains negative in both segments, and management has forecast acceleration before — its medium-term targets are unchanged from the pre-stall framework [50] — without yet delivering it.
What would move the read from bottoming to genuine re-acceleration is specific and checkable in the next two quarterly reports:
Four falsifiable markers, each checkable in the quarterly earnings releases and calls: (1) ex-US-federal CV growth stepping above roughly 4% from the current 3.5%; (2) GTS or GBS new business turning positive year-on-year for the first time since 2024; (3) GTS wallet retention holding its uptick and GBS wallet retention ceasing to fall; (4) the second-quarter 2026 print, the first clean read once the largest federal non-renewals lap.
The second quarter carries the most information, because it is a heavier new-business quarter and the point at which the federal comparison eases the most [51]. If ex-federal CV growth is still stuck near 3.5% and new business is still negative once that comparison clears, the stall looks more structural than management's framing allows. If new business turns and ex-federal growth steps up, the case that this was a federal-and-macro air pocket in a durable franchise gets its first hard confirmation — and with it, the free-cash-flow base that the Valuation Reset capitalizes.
Conferences and Consulting
Conferences and Consulting together are about 18% of revenue but only 11% of gross contribution, so they do not drive Gartner's value — Insights does. They earn a chapter because they are two live, opposite-signed reads on the same discretionary-spend cycle the rest of this report is trying to call. In 2025 Conferences revenue grew 9% currency-neutral to $644.7 million on rising vendor demand [1], while Consulting slipped 2% as utilization and backlog rolled over [2].
The smaller two-tenths
Conferences Revenue ($M)
▲ 9% FX-neutral YoY
Conferences GC Margin
Consulting Revenue ($M)
▼ -2% FX-neutral YoY
Source: FY2025 Annual Report (Form 10-K), Executive Summary and Segment Results [3] [4].
Gartner reports three segments. Insights — the research-subscription engine documented in The Subscription Engine — is 82% of revenue and, at a 77% gross-contribution margin, 89% of the company's $4.47 billion of segment gross contribution. Conferences and Consulting are the rest: $644.7 million and $552.5 million of revenue respectively, but a combined $509 million of gross contribution, or 11% of the total.
Source: derived from FY2025 segment results, Form 10-K [5].
The disproportion matters for how much weight either segment can carry. A good year in Conferences adds tens of millions of gross contribution, not hundreds; the value case still turns on the Insights installed base. What the two smaller segments offer instead is timing. Contract value reaches Insights revenue with roughly a one-year lag (Inflection Test), so the subscription line is a slow, smoothed signal. Conferences and Consulting price and deliver in the quarter, which makes them a faster gauge of how freely clients and technology vendors are spending right now.
Conferences: more revenue from fewer events
Conferences is the more revealing of the two. It is Gartner's most discretionary line — in-person events funded from travel and marketing budgets that are the first to be cut when spending tightens — and it was the segment the pandemic hit hardest. Gartner cancelled all in-person conferences from March 2020 through December 2021, and revenue fell to $120.1 million in 2020 before a virtual-only 2021 recovered it to $214.4 million [6].
Sources: company filings, as reported; FY2020–FY2021 from FY2021 Form 10-K [7], FY2025 from FY2025 Form 10-K [8].
By 2025 the segment had not only recovered but passed its pre-pandemic peak — $644.7 million against $477 million in 2019 — and it did so while hosting fewer events. Gartner ran 53 destination conferences in 2025 versus 72 in 2019, and drew 83,727 attendees, down 3% year-on-year and slightly below the 2019 crowd [9]. The room is not bigger. Gartner is extracting more revenue per event from it.
Sources: company filings, as reported; FY2025 count, attendees and revenue per FY2025 Form 10-K [10]. * 2022 was the first full in-person year after the pandemic; 2021's events were virtual.
The engine behind the higher revenue-per-event is the vendor side, not the attendee side. Gartner attributes the 2025 increase primarily to a 15% rise in exhibitor revenue — the technology providers who pay to reach the executives in Gartner's audience [11]. That is a useful, independent signal: even as Gartner's own clients trimmed subscription spend, the vendors that sell to those clients paid more to stand in front of them. The gross-contribution margin rose to 50% from 48%, and Conferences added $41 million of gross contribution in a year when the core subscription engine stalled [12].
The pattern carried into 2026. First-quarter Conferences revenue rose 8% (6% currency-neutral), again on higher exhibitor revenue, across the same 10 events held a year earlier [13]. The segment is heavily seasonal — the fourth and second quarters, which carry Gartner's Symposium/Xpo events, account for the bulk of the year, so a first-quarter read is directional rather than decisive.
Consulting: the coincident soft signal
Consulting points the other way. It is a lumpier, lower-margin business — project-based advisory and benchmarking staffed by roughly 940 billable consultants — and in 2025 it was the piece of Gartner that visibly softened. Revenue fell 1% (2% currency-neutral) to $552.5 million, gross contribution dropped 8% to $186.4 million, and the margin slipped to 34% from 36% [14].
Sources: company filings, as reported; FY2025 figures per FY2025 Form 10-K [15]. Utilization and backlog are the disclosed productivity measures [16].
The two productivity gauges Gartner discloses both point down. Consultant utilization — hours billed over hours available — fell to 61% from 65%, and backlog, the future revenue already contracted, dropped 7% currency-neutral to $173.7 million [17]. Falling utilization against a broadly flat consultant headcount is the mechanism behind the margin slip: the same people billed fewer hours.
The mix inside the segment sharpens the read. The 2025 decline was a 5% drop in labor-based consulting, partly offset by an 11% rise in contract optimization — the practice that helps clients renegotiate their own IT-vendor contracts [18]. Gartner cautions that contract-optimization revenue "may vary significantly" and that 2025 "may not be indicative of future results" [19]. So the segment's headline decline understates the softness in its steadier core: the recurring labor-based work fell 5%, and the only growth came from a volatile line management itself flags as unreliable. The pressure continued into 2026, with first-quarter Consulting revenue down 15% year-on-year [20].
What the two segments say about the cycle
Read together, Conferences and Consulting corroborate a picture of discretionary caution rather than structural collapse — the distinction Inflection Test frames for the subscription engine. The most discretionary line Gartner runs, in-person events, grew 9% currency-neutral with vendor demand up 15%; the most deferrable, project-based consulting, contracted as clients pushed work out. That is the ordinary shape of a spending pause: buyers defer optional projects first and keep paying for the platform and the community. If the softness were structural — clients concluding they no longer need what Gartner sells — the vendor-funded conference and the exhibitor line would be among the first things to go, and they are instead the fastest-growing part of the portfolio.
The counter-case sits in the same numbers, and it is worth stating plainly. Conferences grew on a shrinking audience: attendance fell 3% and the entire increase came from exhibitor pricing and vendor spend, not from more executives choosing to attend [21]. Exhibitor budgets are themselves cyclical, and a monetization lever pulled hard eventually reaches its limit. On the Consulting side, the softness is real and broadening, and the one growing sub-line is the one Gartner says not to extrapolate.
What would move this read is checkable in the next few filings. Conferences attendance turning down rather than merely flat, or exhibitor revenue growth rolling over, would signal the ecosystem itself pulling back — a more worrying tell than any single subscription metric. On the other side, Consulting backlog and utilization stabilizing would confirm that the 2025–26 weakness was a deferral, not a step down. Neither segment will decide the investment case. Both are early, high-frequency evidence on the cyclical-versus-structural read.
Cyclical or Structural
This chapter reconciles the report into two competing readings of the contract-value stall — a cyclical pause and a structural fade — sets out the falsifiable signals that separate them, and brackets what each is worth. The account moat is intact and the category leader is gaining share against a shrinking peer, yet a wallet-retention glide that began before the macro shock, still-negative new business, and Gartner's own filed AI-substitution language keep the structural case alive. At $141.61 the market prices Gartner near the bear end of that bracket.
Share Price (Jul 7, 2026)
Consensus Mean Target
No-Growth Fair Value / sh
2026 FCF Guide ($M, min)
Sources: price and consensus per market data as of Jul 7, 2026; no-growth fair value derived from FY2025 free cash flow of $1,175M at a 9% discount rate (Valuation Reset); 2026 free-cash-flow guidance from the Q1 FY2026 earnings call [1].
The two cases, reconciled
The report's evidence does not resolve cleanly to one story. The same facts that support a cyclical pause carry a structural counter-reading, and the honest description is a table of shared facts rather than a single narrative. Each row below is a number or filing item established earlier in the report, read both ways.
Sources: Q1 FY2026 earnings call [2]; FY2025 Form 10-K segment metrics [3] and risk factors [4]; Forrester FY2025 Form 10-K [5].
The strongest fact for the cyclical case is that account retention never broke: client (logo) retention has sat in an 83-89% band for five years, and GTS logo retention rose to 85% in 2025 even as dollar retention fell [6]. Customers are not leaving; they spent less per account through the IT-budget squeeze and the US-federal cut, and that spend can return. Forrester, the only pure syndicated-research peer, is contracting on every line — contract value down 6%, client retention 77% — so Gartner is winning share of a pressured category at roughly seventeen times its scale [7].
The structural counter is that part of the erosion predates the macro shock. Wallet retention began sliding in 2021-2023, before the 2025 federal cut, and new business is still negative in both segments even after the Q3 2025 trough [8]. Gartner's own 10-K names the mechanism: large language models "could reduce the need to enter our websites," and clients loading proprietary content into LLMs "could reduce the value of our offerings" [9]. If the through-cycle growth rate is now mid-single-digit rather than mid-teens, the franchise is durable but slower — and the multiple, not just the earnings, has to reflect it.
What the scenarios are worth
Most of the equity value tracks the roughly $1.2 billion free-cash-flow stream (Valuation Reset), so the cyclical-versus-structural question comes down to what that stream does over time. Working off the FY2025 free-cash-flow base of $1,175 million, three scenarios bracket the value; the structural and pause cases lean on the no-growth discounted-cash-flow math that Valuation Reset derives, and the recovery case is cross-checked on a re-rating of forward earnings.
Source: derived from FY2025 free cash flow of $1,175M [10] on ~70M shares at a 9% discount rate (Gordon growth); recovery case cross-checked at 15-18x FY2027 consensus EPS of $15.31; current price and consensus per market data as of Jul 7, 2026.
Source: derived from FY2025 free cash flow [11]; no-growth fair value of ~$187 and the implied perpetual-decline arithmetic per Valuation Reset.
The current $141.61 sits inside the structural band. Holding free cash flow merely flat is worth about $187 a share on Valuation Reset's no-growth math, so the market is paying for a mild perpetual decline of roughly 2-3% a year rather than a pause. The consensus mean target of $165 sits at the low end of the cyclical-pause band, and the hold-heavy rating split — four buy, nine hold, two sell — reflects the same unresolved question rather than conviction either way. The recovery case is real but back-end loaded: because contract value reaches revenue with about a one-year lag, even a genuine second-half 2026 acceleration would show up in 2027 revenue, and the 2026 income statement is already largely set — revenue guided to at least $6.405 billion with adjusted EPS carried by a lower share count [12].
What to watch
The scenarios are separated by a short list of falsifiable readings, each a named line in a specific filing. Q2 2026 is the first clean quarter, because the largest US-federal non-renewals lap and the ex-federal number stands on its own.
Sources: Q1 FY2026 earnings call for CV, retention, new business, backlog and free cash flow [13]; FY2025 Form 10-K for the five-year retention band [14] and the Conferences and Consulting figures [15].
Two of these carry more weight than the rest. Client (logo) retention breaking the roughly 83% five-year floor would be the clearest evidence that the moat itself — not just pricing — is failing; nothing in the record yet shows that. And ex-federal contract-value growth after the federal comparison laps is the cleanest read on the underlying trend, because it strips out the one drag management has both sized and dated [16].
Where the evidence points
On balance the record tilts cyclical, with a structural tail that the price already reflects. Total contract-value growth was flat-to-1% from end-2025 into the first quarter of 2026, but excluding a US federal book that was a roughly 250-basis-point drag the base grew 3.5% and GTS wallet retention ticked up to 97% (99% ex-federal) for its first improvement in over a year, while the most discretionary segment, Conferences, grew 9% currency-neutral to $644.7 million on a 15% rise in vendor exhibitor revenue, so vendor willingness to pay to reach Gartner's audience rose even as retained-client subscription spend fell. The account moat is intact (The Moat), the category leader is taking share from a contracting peer, and the cash engine still converts more than 100% of earnings to free cash flow while adjusted EBITDA reached a record $1,611 million (Margins and EPS) [17]. That Q1 2026 pattern — engagement up 170 basis points alongside the retention turn — is consistent with a bottoming rather than a deepening (Inflection Test). Against that, the wallet glide that predates the federal cut and the filed AI-substitution risk argue that the through-cycle growth rate is now lower than the CEB-era mid-teens, so the durable outcome is probably a slower compounder, not a re-acceleration to prior form.
At $141.61 — below a no-growth valuation of the cash stream — the market is paying close to the structural case, which skews the risk-reward favorably if the free-cash-flow base merely holds. The condition that would break that read is the base itself eroding: a cheap multiple on a shrinking cash stream is a value trap, not a margin of safety, and the swing variable is whether contract value re-crosses into growth once the federal drag clears. The signals above, read quarter by quarter through 2026, are what decide between the two — and because of the one-year lag from contract value to revenue, the cleaner read belongs to 2027, not this year.